

A management report is an internal document that gives leadership a clear, current picture of business performance so they can make faster, better-informed decisions. Unlike audited financial statements, these reports are built for action, not compliance.
TL;DR: Management reports translate raw operational and financial data into focused intelligence for internal audiences, from department heads to the board, with the goal of driving decisions, not satisfying regulators.
Here is what this guide covers:
- The seven most common report types and when to use each
- The core components every management report should include
- A step-by-step process to build, distribute, and act on reports consistently
Table of Contents
- What types of management reports do you actually need?
- How does management reporting differ from financial reporting?
- Why do management reports matter for business outcomes?
- What should you include in a management report?
- How do you create a management report step by step?
- What makes a management report actually effective?
- How do you use management reports to make better decisions?
- What does industry research say about effective reporting?
- Key Takeaways
- The part most reporting guides skip
- Amcfo helps you build reporting that actually drives decisions
- Useful sources and further reading
What types of management reports do you actually need?
Not every report serves the same audience or the same question. The most useful way to think about types of management reports is by the decision they support, not by their name.
A tiered reporting structure — operational reports daily or weekly, current-period reports monthly, and final period-end reports at close — helps stakeholders get the right level of detail at the right time without drowning in data.
- Operational report — tracks daily or weekly activity (units produced, tickets resolved, orders shipped). Used by team leads and operations managers to catch execution problems before they become financial ones.
- KPI scorecard — a one-page snapshot of the metrics that matter most to leadership. Reviewed weekly or monthly; the CEO or department head uses it to confirm the business is on track or to flag a course correction.
- Budget vs. actual report — compares planned spend and revenue against real results for the period. Finance teams produce this monthly, typically within a short period after month-end, and it drives the most common management conversation: why did we miss, and what changes?
- Rolling forecast — updates the forward view of revenue, costs, and cash every month or quarter as new data arrives. CFOs and FP&A teams use it to replace the static annual budget with something that reflects current reality.
- Cash-flow forecast — projects cash in and out over the next 4–13 weeks. Critical for any business managing tight liquidity; the CEO and CFO review it weekly.
- Departmental P&L — breaks company-wide profit and loss down to a single function (marketing, sales, a product line). Department heads use it to understand their cost structure and contribution margin.
- Board pack — a quarterly or monthly compilation of financial summaries, KPI scorecards, risk updates, and strategic progress notes prepared for board members. It is the highest-stakes report in the stack and demands the tightest narrative.
How does management reporting differ from financial reporting?
This is the question finance teams get most often, and the answer matters because the two documents serve completely different masters.

| Dimension | Management report | Financial report |
|---|---|---|
| Audience | Internal: managers, executives, board | External: investors, lenders, regulators, tax authorities |
| Purpose | Support decisions and track performance | Demonstrate compliance and financial position |
| Timing | Produced as often as needed (daily to quarterly) | Produced on a fixed statutory schedule (quarterly, annually) |
| Format | Flexible; tailored to the reader | Standardized under GAAP or IFRS |
| Rules | No external standards; management sets the format | Legally regulated; must be audited or reviewed |
| Orientation | Forward-looking (forecasts, scenarios) | Backward-looking (historical actuals) |
Management reports are internal, non-mandatory documents with no fixed external standards, which is exactly what gives them their power. You can design them around the question your CFO is actually asking this month, not around what the SEC requires.
A concrete example: your internal 13-week cash-flow forecast is a management report. It shows projected receipts and disbursements so you can decide whether to delay a hire or draw on a credit line. The audited cash-flow statement in your annual report covers the same topic but looks backward, follows GAAP presentation rules, and tells a lender what happened, not what is coming.
When you need both:
- Use management reports for every internal operating decision: pricing, hiring, capital allocation, and performance reviews.
- Use financial reports for external obligations: bank covenants, tax filings, investor disclosures, and audits.
- Reconcile the two at period-end to confirm that management figures and statutory figures tell a consistent story.
Why do management reports matter for business outcomes?
The short answer: they convert data you already have into decisions you can actually make. Without a structured reporting process, most businesses are reacting to last month's surprises rather than managing toward next month's goals.

Management reporting turns raw, fragmented data into consistent intelligence that connects day-to-day operations with strategic planning and accountability. That connection is what separates businesses that grow deliberately from those that grow accidentally.
The specific benefits are concrete, as illustrated by experiences with consulting engagements:
- Faster decisions — leadership sees the right metrics in one place instead of chasing numbers across spreadsheets and systems.
- Accountability — when KPIs are visible and owned, teams behave differently. A sales leader who sees pipeline coverage in the weekly scorecard acts on it; one who gets a quarterly email does not.
- Performance tracking — management reports help managers track KPIs, set goals, allocate resources, and evaluate department-level performance in a consistent, comparable way.
- Better forecasting — rolling forecasts updated with real data beat static annual budgets on accuracy every time.
- Resource allocation — variance analysis tells you where money is being spent against plan, which makes reallocation conversations factual rather than political.
A practical example: A SaaS company's monthly report shows a significant increase in customer acquisition cost (CAC) while new logo count is flat. That single variance triggers a decision to pause paid search, redirect budget to outbound, and update the Q3 forecast. Without the report, the overspend runs another quarter before anyone notices.
What should you include in a management report?
The best management reports are concise and lead with an executive summary that leadership can read in under two minutes. Everything else supports that summary with evidence.
Core components checklist:
- Executive summary — two to four sentences: where the business stands, the biggest variance, and the recommended action.
- P&L summary — revenue, gross margin, operating expenses, and EBITDA for the period versus budget and prior period.
- Cash position and forecast — current cash balance, burn rate or cash generation, and a short-horizon projection.
- KPI dashboard — the five to ten metrics that actually drive the business, with trend direction and RAG (red/amber/green) status.
- Variance analysis — what missed or beat, by how much, and why.
- Forward-looking notes — risks, opportunities, and any forecast adjustments for the next period.
KPI examples by audience:
| Audience | KPIs they care about most |
|---|---|
| CEO / board | Revenue growth, EBITDA margin, cash runway, net promoter score |
| CFO | Gross margin %, operating expense %, days sales outstanding, cash conversion |
| Sales leader | Pipeline value, win rate, average deal size, CAC |
| Customer success | Churn rate, net revenue retention, time-to-value |
| Operations | Headcount vs. plan, utilization rate, cost per unit |
Reports should mix financial statements with operational metrics because non-financial indicators often explain financial variances. A spike in churn explains a revenue miss better than any P&L line can on its own.
Sample one-page report heading structure:
- Header: Company name, report period, date prepared, prepared by
- Executive summary: Three-sentence narrative (performance, key variance, action)
- KPI section: Metrics table with actuals, budget, prior period, and trend
- Variance commentary: Bullet notes on the two or three biggest variances
- Actions and owners: Table of decisions made, owner, and due date
Pro Tip: Keep the KPI section to no more than ten metrics. Reports that track everything track nothing. If a metric does not drive a decision, cut it.
How do you create a management report step by step?
Building a report that people actually read and act on requires a repeatable process, not a one-time heroic effort by the finance team.
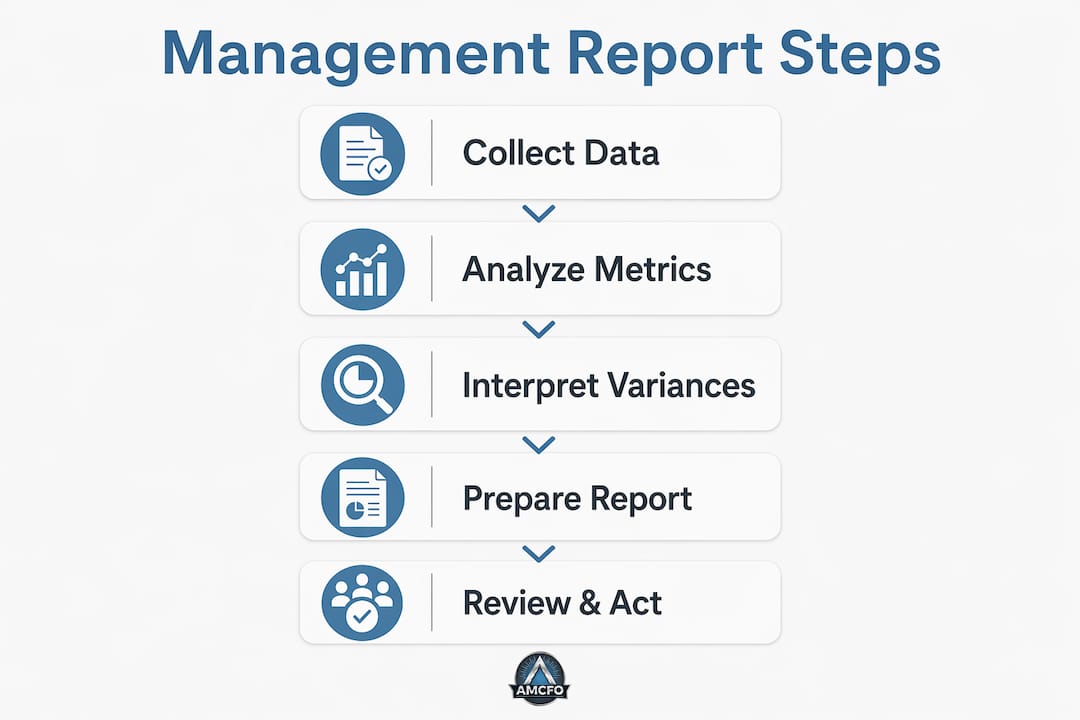
- Define the objective and audience. Who reads this report, and what decision does it need to support? A board pack and a weekly ops report have different audiences, different cadences, and different levels of detail.
- Choose your KPIs. Select metrics that are directly tied to the objective. Consistent metric definitions and allocation rules are what allow stakeholders to compare periods with confidence.
- Source and validate your data. Identify a single source of truth for each metric. Reconcile figures before the report goes out — a number that contradicts last month's report destroys trust faster than a bad result does.
- Analyze variances. Calculate the gap between actual and budget (or prior period). Flag anything outside a defined threshold (commonly ±5–10%) for narrative explanation.
- Write the narrative and recommended actions. This is the highest-value step. Explain what changed, why it changed, and what the team should do about it.
- Design and visualize. Use charts for trends (line charts for revenue, bar charts for period comparisons), tables for detailed breakdowns, and RAG indicators for quick status reads. Keep the layout consistent so readers know where to look.
- Distribute and gather feedback. Send the report before the meeting it is meant to inform, not during it. After the first few cycles, ask readers what they use and what they skip — then cut the latter.
Data quality checklist before you distribute:
- All figures reconcile to the source system (ERP, accounting software, CRM).
- Prior-period comparatives match the previously published report.
- KPI definitions have not changed without a note explaining the change.
- The report was reviewed by at least one person who did not prepare it.
Role matrix:
| Role | Prepares | Reviews | Acts |
|---|---|---|---|
| Finance / accounting | ✓ | ||
| FP&A analyst | ✓ | ✓ | |
| Department head | ✓ | ✓ | |
| CFO | ✓ | ✓ | |
| CEO / board | ✓ |
For practical guidance on implementing a reporting cadence and governance structure, the ownership matrix above is the right starting point.
What makes a management report actually effective?
Structure and data are table stakes. What separates a report that drives decisions from one that gets filed unread is the narrative layer.
Dos:
- Lead with the executive summary, always. Leadership reads the first section; the rest is reference material.
- Keep the report to one to three pages for monthly operating reports. Board packs can run longer, but every page should earn its place.
- Use visuals for trends and comparisons — a sparkline next to a KPI communicates direction faster than a column of numbers.
- Tailor the level of detail to the audience. A department head needs line-item granularity; a board member needs the story.
Don'ts:
- Do not present every available data point. A majority of managers say the most effective reports prioritize what leadership needs to know rather than presenting all available data.
- Do not bury the variance explanation in a footnote. If something missed, say so in the executive summary and explain why.
- Do not change the format every month. Consistency is what lets readers spot anomalies quickly.
Pro Tip: For every significant variance, answer three questions in the commentary: Where are we now? How does that compare to expectations? What are we doing about it? A one-sentence answer to each is enough.
For a deeper look at financial reporting best practices, including visual design and commentary standards, that resource covers the mechanics in detail.
How do you use management reports to make better decisions?
Reading a report is not the same as acting on it. The gap between insight and decision is where most reporting processes break down.
Variance interpretation checklist:
- Is the variance material? Apply a threshold (e.g., ±5% or ±$10,000) and focus attention on what crosses it.
- Is it a timing issue or a structural one? A revenue miss because a deal closed in the next period is different from a miss because win rates dropped.
- Is it isolated or systemic? One department missing budget is a department problem. Three departments missing budget is a planning or market problem.
- Does it require a forecast update? If the variance reflects a permanent change in the business, the rolling forecast needs to move too.
- Who owns the response? Every material variance should have a named owner and a due date for the corrective action.
Action-plan template (link metric to decision):
| Metric | Variance | Root cause | Decision | Owner | Due date |
|---|---|---|---|---|---|
| Gross margin | -3 pts vs. budget | Input cost increase | Reprice Q3 contracts | VP Sales | End of month |
| CAC | — | Paid search efficiency drop | Pause paid search; test outbound | CMO | This week |
| Cash runway | 2 months shorter than forecast | AR collections delayed | Accelerate collections; review credit terms | CFO | Immediate |
Integrating reports into meeting cadences:
- Weekly team meeting: Review the operational report or KPI scorecard. Focus on execution issues and blockers.
- Monthly leadership meeting: Walk through the full management report. Approve forecast changes and resource decisions.
- Quarterly board meeting: Present the board pack. Discuss strategic performance, risks, and capital allocation.
Non-financial indicators like headcount, churn, and pipeline value belong in these conversations because they explain the drivers behind P&L and cash movements. A board that only sees the income statement is missing half the story.
What does industry research say about effective reporting?
The evidence on what makes reporting work is consistent across sources, and it points to a few specific practices that most teams still get wrong.
Management reporting is a continuous process of collecting, analyzing, and presenting data tailored to different internal audiences. The word "continuous" matters. Teams that treat reporting as a monthly scramble produce reports that are late, inconsistent, and distrusted. Teams that build it into their operating rhythm produce reports that leadership actually waits for.
The highest-value skill in the entire process is variance interpretation. The best reports explain not just what changed but why it changed and what action is recommended. Most reports get the "what" right. Very few get the "why" and "what next" right consistently.
From an Amcfo perspective, the single most common fix for businesses that struggle with reporting is not better software. It is defining who owns each metric, agreeing on the calculation method, and committing to a delivery date. Those three decisions alone transform a chaotic monthly close into a process leadership trusts. For businesses that want outside expertise to build that foundation, strategic management consulting is often the fastest path from reporting chaos to reporting clarity.
Key Takeaways
Management reports work when they are focused, consistent, and built around the decisions leadership needs to make, not around the data finance happens to have.
| Point | Details |
|---|---|
| Lead with the executive summary | Put the most important finding and recommended action in the first two to four sentences — leadership reads that and acts on it. |
| Match report type to cadence | Operational reports run daily or weekly; budget vs. actual and KPI scorecards run monthly within 5–10 working days of month-end. |
| Explain variances, not just numbers | For every material variance, state what changed, why it changed, and what the team will do about it. |
| Mix financial and non-financial KPIs | Metrics like churn, pipeline, and headcount explain P&L movements that the income statement alone cannot. |
| Amcfo builds reporting processes | Amcfo's fractional CFO and accounting services help businesses establish consistent, decision-ready reporting from data sourcing through narrative delivery. |
The part most reporting guides skip
There is a version of management reporting advice that focuses almost entirely on format: use a one-page layout, pick the right chart type, color-code your RAG indicators. That advice is not wrong. It is just incomplete in a way that costs businesses real money.
The harder problem is organizational, not visual. A report is only as trustworthy as the data behind it, and data quality is a people problem before it is a systems problem. When the sales team logs deals differently than finance recognizes revenue, the pipeline number and the revenue number will never reconcile, and leadership will stop trusting both. No dashboard fixes that.
The second thing most guides underemphasize is the cost of reporting that is technically accurate but strategically useless. A report that shows 47 metrics, none of them explained, is not a management report. It is a data dump with a logo on it. The discipline of cutting metrics, of deciding that churn matters more than social media followers this quarter, is where real reporting value comes from. That discipline requires someone with enough business context to make the call, which is why finance teams that work closely with operations produce better reports than those that work in isolation.
Amcfo helps you build reporting that actually drives decisions
Most businesses already have the data. What they are missing is a reporting process that turns that data into a clear monthly picture leadership can act on.

Amcfo's fractional CFO services are built for exactly this: businesses that need senior financial leadership without the cost of a full-time hire. The engagement covers the full reporting stack, from clean books and accurate data sourcing through KPI design, variance narrative, and board-ready presentation.
- Faster monthly close — structured data processes and clear ownership cut the time between month-end and report delivery.
- Decision-ready reports — KPIs tailored to your business model, with variance commentary that tells leadership what to do, not just what happened.
- Scalable support — whether you need accounting and bookkeeping to get the numbers right or a fractional CFO to lead the entire reporting process, Amcfo scales to where you are.
If your monthly report is late, inconsistent, or going unread, that is a solvable problem. Talk to Amcfo about building a reporting process your leadership team will actually use.
Useful sources and further reading
The sources below back the claims in this article and offer deeper reading on specific topics.
| Resource | What it covers |
|---|---|
| Management Reporting: What Is It, Best Practices & More | Comprehensive overview of management reporting purpose, best practices, and variance interpretation |
| What Is a Management Report? — Grove FP | Concise definition, cadence guidance, and executive summary best practices |
| Managerial Reporting: Definition, Purpose and Best Practices | Purpose, KPI tracking, and department-level performance use cases |
| Purpose of Management Reporting — PPN Solutions | Strategic value and how reporting connects operations to long-term planning |
| Management Reporting: Essence, Structure, and Preparation | Academic treatment of tiered reporting structures and cadence design |
| Management Reporting Glossary — Wolters Kluwer | Authoritative definition and scope of management reports vs. regulatory reports |
| Management Accounts Explained — Amcfo blog | Templates, P&L interpretation, and KPI design for internal reporting |
| Financial Reporting Best Practices — Amcfo blog | Practical guidance on report design, visuals, and commentary standards |
| The Role of Financial Statements in Decisions — Amcfo blog | How statutory financial statements and management reports interact |