

Business profitability analysis is the systematic process of evaluating a company's ability to generate profit by examining revenue streams, cost structures, and financial performance metrics. Every business owner and financial manager needs this process to answer one fundamental question: where exactly is money being made, and where is it being lost? The analysis draws on three core financial statements: the Income Statement, the Balance Sheet, and the Cash Flow Statement. Together, these documents reveal whether your business is truly profitable or simply generating revenue. Understanding what is business profitability analysis is the first step toward making financial decisions that actually move the needle.
What are the key business profitability metrics?
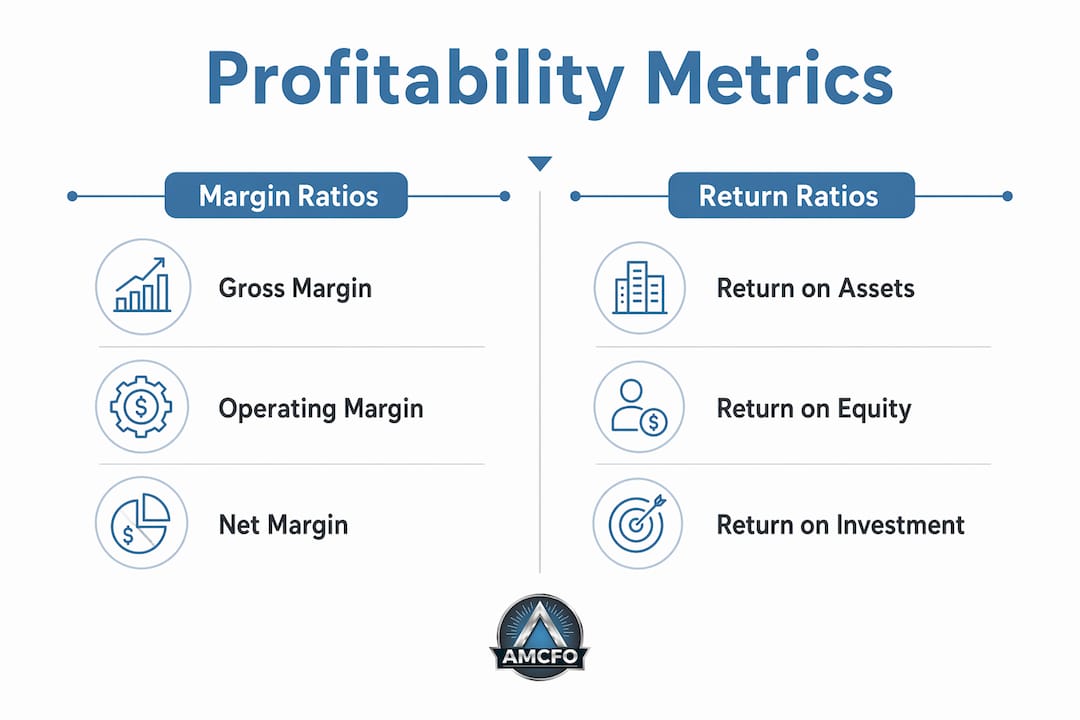
Profitability metrics fall into two main categories: margin ratios and return ratios. Margin ratios measure profit relative to sales. Return ratios measure profit relative to assets or equity. Both categories serve different analytical purposes, and you need both to get a complete picture.
Margin ratios tell you how much of each revenue dollar survives after costs:
- Gross Profit Margin = (Revenue minus Cost of Goods Sold) / Revenue. This shows production efficiency before overhead enters the picture.
- Net Profit Margin = Net Income / Revenue. This is the bottom line after every cost, tax, and interest payment.
- Contribution Margin = Revenue minus Variable Costs. This metric is critical for pricing decisions and break-even calculations.
Return ratios measure how effectively the business uses its resources:
- Return on Assets (ROA) = Net Income / Total Assets. A higher ROA means the business extracts more profit from every dollar of assets it holds.
- Return on Equity (ROE) = Net Income / Shareholder Equity. This ratio matters most to investors and owners evaluating capital efficiency.
| Ratio | Formula | Primary Use |
|---|---|---|
| Gross Profit Margin | (Revenue − COGS) / Revenue | Assess production cost control |
| Net Profit Margin | Net Income / Revenue | Measure overall profitability |
| Return on Assets | Net Income / Total Assets | Evaluate asset efficiency |
| Return on Equity | Net Income / Equity | Gauge capital returns |
| Contribution Margin | Revenue − Variable Costs | Support pricing and break-even work |
The most important discipline in ratio analysis is tracking trends over time. Consistent margin improvement across multiple periods reveals far more than a single strong quarter. One spike in net profit could reflect a one-time event. A steady upward trend in gross margin signals genuine operational improvement.
Pro Tip: Set a calendar reminder to review your key ratios monthly, not quarterly. Monthly tracking catches margin erosion before it becomes a crisis.
How is a business profitability analysis performed step by step?
A standard profitability analysis follows four core steps. Each step builds on the last, and skipping any one of them produces incomplete results.
-
Collect financial and operational data. Pull figures from your Income Statement, Balance Sheet, and Cash Flow Statement. These three financial statements supply revenue, costs, assets, equity, and cash flow data. If your books are not current and accurate, every ratio you calculate will be wrong.
-
Calculate your profitability ratios and margins. Apply the formulas for gross margin, net margin, ROA, ROE, and contribution margin. Do not stop at one ratio. Each metric answers a different question, and together they form a complete financial portrait.
-
Segment the analysis by product, customer, region, or sales channel. This step is where real insight lives. Some high-revenue products carry razor-thin margins or even losses once all costs are allocated. A customer who generates $500,000 in annual revenue but requires $480,000 in service costs is not a good customer. Segmentation exposes these hidden realities.
-
Perform break-even analysis. The break-even point equals Total Fixed Costs divided by the Contribution Margin ratio. This calculation tells you the minimum sales volume needed to cover all costs. Every dollar above that threshold is profit. Knowing this number is non-negotiable for pricing and capacity decisions.
Two common pitfalls undermine this process. First, many businesses ignore overhead allocation when calculating product-level margins. If you do not assign a fair share of rent, utilities, and administrative costs to each product or service, your segment analysis will overstate profitability. Second, accrual accounting records revenue when earned, not when cash arrives. A business can show strong profit on paper while running short on cash. Always link your profitability report to your cash flow analysis to confirm the numbers reflect reality.
Pro Tip: Use contribution margin by product line before allocating fixed costs. This tells you which products cover their own variable costs and which ones do not, a critical distinction before you cut anything.

What are the challenges in interpreting profitability analysis?
Interpreting profitability results accurately requires more than reading the numbers. Several factors can distort what those numbers appear to say.
Accrual accounting is the most common source of confusion. Under accrual rules, expenses are recorded when incurred, not when paid. This means a business can report strong net income in a period when it has actually spent more cash than it collected. The profit is real in an accounting sense, but the cash position may be dangerously low. Pairing profitability reports with a cash flow statement resolves this discrepancy.
Industry benchmarking is the second major interpretive challenge. A 10% net profit margin looks weak in a software company but strong in a grocery chain. Benchmarking against industry-specific standards is the only way to know whether your margins are competitive. Comparing your ratios to generic averages across all industries produces misleading conclusions. Capital-intensive businesses like manufacturing carry higher asset bases and naturally lower ROA figures than service firms with minimal physical assets.
Treating profitability analysis as a backward-looking report is the most expensive mistake a business owner can make. The real power of this process is predictive. When you track margin trends and segment performance consistently, you can spot a pricing problem or a cost creep before it damages your bottom line. Profitability analysis should inform decisions before profits suffer, not explain why they already did.
A single high-profit period also deserves skepticism. It may reflect a large one-time contract, a delayed expense, or a favorable currency movement. Trend analysis across multiple periods is the only reliable way to distinguish genuine performance from statistical noise.
How does profitability analysis improve business decisions?
Profitability analysis is most valuable when it drives specific decisions, not when it sits in a report. Here is how financial managers apply it in practice.
Pricing adjustments. If your contribution margin on a product is shrinking quarter over quarter, your pricing has not kept pace with cost increases. Profitability data gives you the evidence to raise prices with confidence rather than guessing.
Product and customer focus. Segmented profitability data identifies which products and customers generate the most profit, not just the most revenue. Redirecting sales and marketing resources toward high-margin segments produces better returns without increasing total costs.
Cost control. When gross margin declines but revenue holds steady, the problem is in the cost of goods sold. Profitability analysis pinpoints this before it reaches the net income line. You can investigate supplier pricing, production waste, or labor efficiency before the damage compounds.
Budgeting and forecasting. Margin trends from past periods form the foundation of reliable financial modeling. If your gross margin has averaged 42% for three years, building a budget that assumes 55% is a planning error waiting to happen.
Strategic growth decisions. Before entering a new market or launching a product line, profitability analysis of your existing segments tells you which capabilities generate the highest returns. You invest where your margins are strongest, not where your revenue is largest.
Pro Tip: Run a customer-level profitability report at least once a year. You will almost always find that 20% of your customers generate 80% of your profit. That knowledge changes how you allocate sales time and service resources.
Key Takeaways
Profitability analysis is most effective when it combines margin and return ratios, segment-level data, and trend tracking to drive forward-looking business decisions.
| Point | Details |
|---|---|
| Use both ratio categories | Track margin ratios and return ratios together for a complete financial picture. |
| Segment before you cut | Analyze profitability by product, customer, and channel before making cost decisions. |
| Pair with cash flow data | Accrual accounting can show profit while cash is tight; always check both reports. |
| Benchmark by industry | Compare your ratios to sector-specific standards, not generic cross-industry averages. |
| Track trends, not snapshots | Consistent margin improvement over multiple periods matters more than any single result. |
Why revenue is not the same as profit
After years of working with business owners across industries, the pattern I see most often is this: a business grows revenue aggressively and assumes profitability will follow automatically. It rarely does. Revenue and profit are not the same number, and confusing them is the most expensive mistake I encounter.
The businesses that get profitability analysis right treat it as a living process, not a year-end exercise. They review margins monthly, segment their customers and products at least quarterly, and connect every major pricing or hiring decision to the numbers. The ones that struggle run profitability reports after something goes wrong, which means they are always reacting instead of planning.
I also see a consistent underestimation of how much accrual accounting distorts the picture. A business owner sees strong net income and feels confident. Then the bank account tells a different story. Combining profitability reports with cash flow tracking is not optional. It is the only way to know whether the profit you see on paper is real money you can use.
The other habit that separates high-performing financial managers from average ones is industry benchmarking. Your margins do not exist in a vacuum. Knowing that your net margin is 8% means nothing until you know whether your industry peers average 5% or 15%. That context is what turns a number into a decision.
If you want to go deeper on the methods behind this process, the profit analysis methods resource from Amcfo covers the technical side in detail.
— Angelica
Amcfo's financial analysis services for business owners
Accurate profitability analysis starts with accurate books. If your financial data is incomplete or inconsistently recorded, every ratio you calculate is built on a shaky foundation.

Amcfo provides accounting and bookkeeping services that keep your financial records current, categorized, and ready for analysis at any time. Beyond the books, Amcfo's fractional CFO services give you access to senior-level financial guidance without the cost of a full-time hire. That means regular profitability reviews, margin analysis by segment, and strategic input on pricing, budgeting, and growth decisions. For business owners who want clear answers from their financial data, Amcfo provides the structure and expertise to get there.
FAQ
What is business profitability analysis?
Business profitability analysis is the process of evaluating how effectively a company converts revenue into profit by examining margin ratios, return ratios, and cost structures across products, customers, and time periods.
What financial statements are used in profitability analysis?
The Income Statement, Balance Sheet, and Cash Flow Statement supply the core data points, including revenue, costs, assets, equity, and cash flows, needed to calculate profitability ratios.
What is the difference between gross profit margin and net profit margin?
Gross profit margin measures profit after subtracting the cost of goods sold, while net profit margin measures profit after all costs, taxes, and interest are deducted from revenue.
Why does accrual accounting affect profitability analysis?
Accrual accounting records expenses when incurred rather than when paid, which can show strong net income while actual cash on hand is low. Pairing profitability reports with cash flow analysis corrects this distortion.
How often should a business run a profitability analysis?
Monthly ratio tracking catches margin problems early, while a full segmented profitability review should occur at least quarterly to support pricing, budgeting, and resource allocation decisions.