
Revenue feels like the most honest signal your business sends. It's visible, trackable, and satisfying when it grows. But revenue alone can mask insolvency — a business pulling in $1 million a year can still be months away from collapse if liquidity, profitability, and debt are misaligned. To genuinely measure business financial health, you need a framework that goes beyond the top line. This guide walks through the exact statements, ratios, and processes that give you a complete, accurate picture.
Table of Contents
- Key takeaways
- How to measure business financial health: the core statements
- Critical financial ratios to evaluate right now
- Trend analysis and benchmarking to add real context
- Warning signs that need your attention now
- Your step-by-step financial health check
- My honest take on what most businesses get wrong
- Get expert support to track and improve your financial health
- FAQ
Key takeaways
| Point | Details |
|---|---|
| Revenue misleads without context | Profitability, liquidity, and debt metrics together reveal true financial stability. |
| Three statements form the foundation | Income statement, balance sheet, and cash flow statement each answer a different health question. |
| Ratios need benchmarks to mean anything | Compare your current ratio, ROE, and margins against industry peers, not just last quarter. |
| Trend analysis beats single snapshots | Analyzing 3 to 4 periods of data reveals patterns that one period's numbers will hide. |
| Early warnings exist outside financials | Leading indicators like customer churn and order backlog signal trouble before your ratios do. |
How to measure business financial health: the core statements
Before you calculate a single ratio, you need clean, accurate source data. That data lives in three financial statements, and each one answers a different question about your company.
The income statement tells you whether your business is profitable. It captures revenue, cost of goods sold, operating expenses, and net profit over a specific period. If your gross margin is eroding quarter over quarter, the income statement will show it. If expenses are growing faster than revenue, the income statement confirms it before the damage becomes severe.
The balance sheet is a snapshot of what your business owns, what it owes, and what's left over for shareholders. It reveals liquidity, leverage, and long-term financial stability in a way the income statement cannot. A company might report strong net profit while quietly accumulating debt that exceeds its assets. The balance sheet surfaces that risk.
The cash flow statement tracks actual cash moving in and out of the business. Positive operating cash flow is the gold standard of financial strength because it shows your core business generates real cash, not just accounting profit. A profitable business can still fail if it runs out of cash. These three statements together form the only honest foundation for any serious financial analysis.
Key reasons each statement matters:
- The income statement reveals pricing power and expense discipline
- The balance sheet exposes debt load and asset strength
- The cash flow statement confirms whether profit translates to actual liquidity
- All three must align for a reliable health assessment
Critical financial ratios to evaluate right now
No single metric suffices for a full picture of financial health. You need ratios across four dimensions: profitability, liquidity, efficiency, and solvency. Here is what to track and what the numbers mean.
| Ratio | Healthy Range | Warning Sign |
|---|---|---|
| Current Ratio | 1.5 or higher | Below 1.0 signals insolvency risk |
| Debt-to-Assets | 0.3 to 0.6 | Above 0.6 indicates high leverage risk |
| Return on Equity (ROE) | 15% or higher | Below 10% signals weak returns |
| Gross Profit Margin | Above 50% (varies by industry) | Below 20% exposes cost vulnerability |
| Net Profit Margin | 10%+ for most industries | Declining trend warrants immediate review |
Current ratio measures whether you can cover short-term obligations with short-term assets. A current ratio below 1.0 is a critical warning: you owe more in the near term than you can cover. A ratio of 1.5 or higher gives you breathing room.

Debt-to-assets ratio tells you how much of your business is financed by debt. A ratio between 0.3 and 0.6 is generally manageable. Above 0.6, debt starts crowding out your flexibility and raising the cost of any future capital you need.
Return on equity measures how effectively you are generating profit from shareholders' investment. ROE above 15% signals strong performance across most industries. Falling ROE combined with rising revenue is a clear sign that costs are consuming your gains.
Gross and net profit margins reveal two different layers of your business model. A gross margin above 50% suggests strong pricing power. A declining net margin tells you operating expenses or interest costs are eating into what should be profit.
Pro Tip: Calculate your operating cash flow ratio alongside your current ratio. A business can look liquid on the balance sheet but still fail to generate enough cash from operations to service debt. Both numbers together give a more complete picture of real liquidity.
Trend analysis and benchmarking to add real context
A single period of ratios tells you where you stand today. What it cannot tell you is whether you are improving, declining, or simply tracking with your industry. That requires trend analysis and benchmarking.
Here is how to apply both effectively:
-
Pull three to four periods of data. Monthly, quarterly, or annual, depending on your business cycle. Trend analysis across multiple periods smooths out seasonal noise and reveals the actual direction of your margins, cash flow, and leverage.
-
Plot each ratio over time. A gross margin that was 45% two years ago and is now 38% is a meaningful decline, even if 38% still looks acceptable in isolation. Direction matters as much as the number itself.
-
Benchmark against your industry. Internal trends tell half the story. Benchmarking against peers tells you whether your performance gaps are company-specific problems or market-wide conditions. If your margins are shrinking while industry margins are stable, the problem is internal. If both are shrinking, it is a sector-wide pressure.
-
Layer in non-financial leading indicators. Customer churn rate, average days to close a sale, return rates, and employee turnover are forward-looking data points that often signal financial deterioration before your ratios reflect it. These are especially useful for strategic growth planning because they give you time to act before the income statement catches up.
Pro Tip: Do not benchmark only against industry averages. Find three to five direct competitors of similar size and stage. Averages include outliers that distort the picture. Your most relevant comparison set is businesses that share your cost structure and customer profile.
Warning signs that need your attention now
Most financial crises do not arrive without warning. They announce themselves quietly through patterns most business owners miss or rationalize. Combined leading and lagging indicators provide the richer view needed to catch these signals early. Here are the red flags that demand attention:
- Revenue growing while margins shrink. This almost always means costs are rising faster than sales. It feels like success but it is a structural problem that compounds over time.
- Slow receivables turnover. If customers are taking 60 to 90 days to pay when your terms say 30, your reported profit is real but your cash is not. This stresses operations even when the income statement looks healthy.
- Debt-to-assets creeping above 0.6. Increasing leverage limits your options when conditions change. Lenders notice before you do.
- Erratic cash flow cycles. Unpredictable cash swings make it impossible to plan payroll, capital purchases, or inventory. They are a sign of either poor collections, unstable demand, or both.
- No cash reserve. Maintaining a reserve covering three to six months of operating expenses is not conservative. It is a minimum. Businesses without a buffer have no room to absorb disruption.
Effective cash flow management is often the difference between catching these warning signs early and discovering them too late.
Your step-by-step financial health check
Applying everything above to your actual financials requires a process. Follow these steps to conduct a thorough review:
-
Gather and verify your statements. Collect your income statement, balance sheet, and cash flow statement for the last three to four periods. Confirm the data is accurate and reconciled. Errors in source data produce misleading ratios regardless of your analysis.
-
Calculate your key ratios. Work through current ratio, debt-to-assets, ROE, gross margin, net margin, and operating cash flow ratio. Use the benchmarks in the table above as your initial reference points.
-
Run trend analysis. Map each ratio across your periods. Identify which metrics are improving, which are declining, and which are stable. Pay extra attention to metrics moving in the wrong direction even if their absolute levels still look acceptable.
-
Benchmark externally. Source industry data from trade associations, financial databases, or a business consulting partner who tracks sector benchmarks. Compare your ratios against companies at a similar revenue level and stage.
-
Incorporate leading indicators. Pull your customer retention rate, average collection period, and order pipeline data. Use these alongside your financial ratios to assess where the business is headed, not just where it stands.
Below is a simplified health check framework you can adapt for your own review cycle:
| Review Step | Frequency | Tool or Source |
|---|---|---|
| Update key ratios | Monthly | Accounting software or CFO report |
| Trend analysis review | Quarterly | Spreadsheet or financial dashboard |
| Industry benchmarking | Annually (at minimum) | Trade data or consulting partner |
| Leading indicator review | Monthly | CRM, operations reports |
| Cash reserve assessment | Monthly | Bank reconciliation |
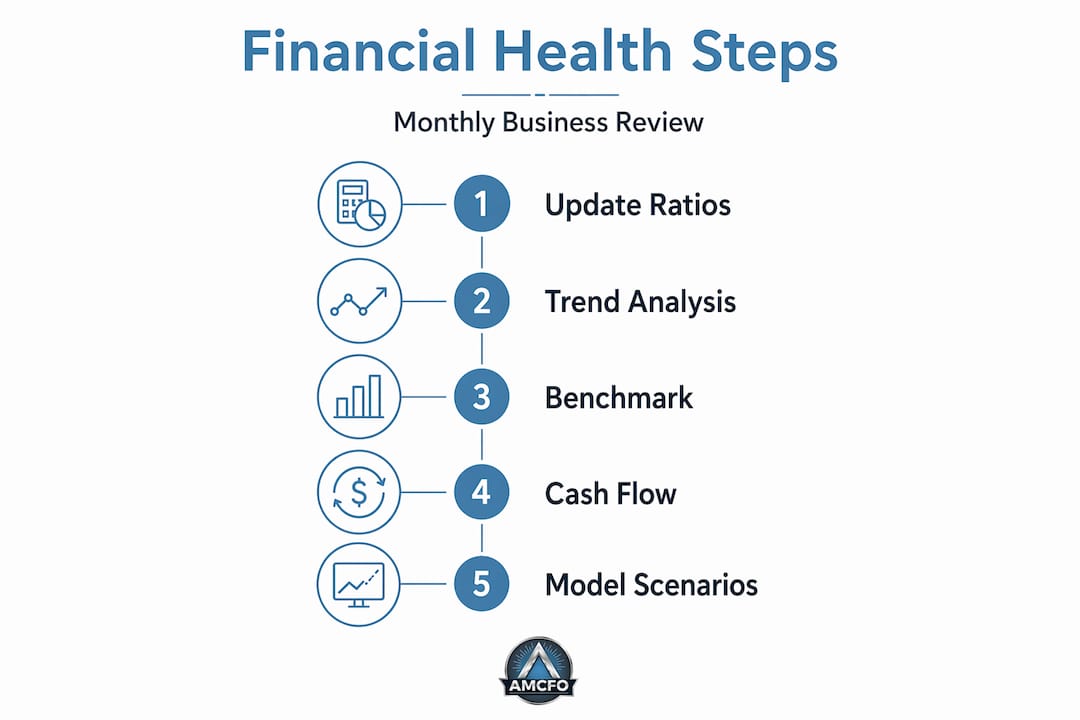
Financial modeling can extend this process into forward-looking scenarios, helping you stress-test your financial position before problems materialize.
My honest take on what most businesses get wrong
I have worked with enough business owners to say this with confidence: the ratio calculations are rarely the hard part. The hard part is honesty about what the numbers mean.
In my experience, the most dangerous moment for a business is when the revenue line is growing but the owner has not noticed that margins are quietly compressing. It feels like winning. The bank account looks fuller than last year. But underneath, the unit economics are deteriorating, and by the time the cash flow statement makes it undeniable, the options have narrowed considerably.
What I have found actually works is combining financial ratios with a handful of non-financial indicators reviewed on a fixed schedule, not whenever someone gets around to it. Managers focused on leading indicators make better, faster decisions precisely because they are not waiting for the income statement to confirm what the early signals already told them.
The other thing most businesses skip is real benchmarking. Not "we are up 10% year over year" but "our gross margin is 8 points below the industry median and we have never asked why." Benchmarking distinguishes whether your challenges are internal or market-driven, and that distinction completely changes your response.
Early intervention is not a finance concept. It is a survival skill. The businesses I have seen navigate disruption well are almost always the ones that track the right metrics consistently, compare themselves honestly against peers, and do not wait until a crisis forces the conversation.
— Angelica
Get expert support to track and improve your financial health
Knowing what to measure is only half of it. Having clean, accurate data to measure against is the other half, and that is where most businesses struggle most.

Amcfo provides accounting and bookkeeping services that give you the accurate financial statements your health analysis depends on. Beyond that, Amcfo's fractional CFO services cover ongoing financial management, ratio tracking, benchmarking, and strategic planning tailored to your specific business. Whether you need a one-time financial review or continuous CFO-level guidance, Amcfo brings the structure and expertise to turn your financial data into decisions you can act on with confidence. Explore how financial management and planning support from Amcfo can give your business the financial clarity it needs to grow.
FAQ
What does it mean to measure business financial health?
Measuring business financial health means evaluating profitability, liquidity, solvency, and efficiency using key financial ratios and statements over time. No single metric provides a complete view; all dimensions must be assessed together.
What is a healthy current ratio for a business?
A current ratio of 1.5 or higher indicates your business can comfortably cover short-term obligations. A ratio below 1.0 is a critical warning sign of potential insolvency risk.
How often should I review my financial health metrics?
Key ratios should be reviewed monthly, trend analysis quarterly, and industry benchmarking at least annually. More frequent reviews give you earlier warning of deteriorating performance.
What is the difference between profitability and liquidity?
Profitability measures whether your business earns more than it spends over a period. Liquidity measures whether you have enough cash on hand right now to meet obligations. A business can be profitable but illiquid, which is one of the most common causes of unexpected business failure.
What are leading indicators in financial health analysis?
Leading indicators are non-financial data points such as customer churn rate, order backlog, and average collection period that signal future financial performance before it shows up in your ratios or statements.