
Profit analysis is the systematic evaluation of a company's revenue streams and costs to determine true profitability and guide financial decisions. Financial managers who master this process move beyond headline net income figures and into the mechanics of what actually drives earnings. The core toolkit includes break-even analysis, margin ratio evaluation, benchmarking against industry standards, and qualitative assessment of market conditions. Reliable profitability assessment draws on three financial statements: the income statement, the cash flow statement, and the balance sheet. ERP systems and business intelligence tools make it possible to run this analysis at scale and with consistency.
What are the key quantitative methods in profit analysis?
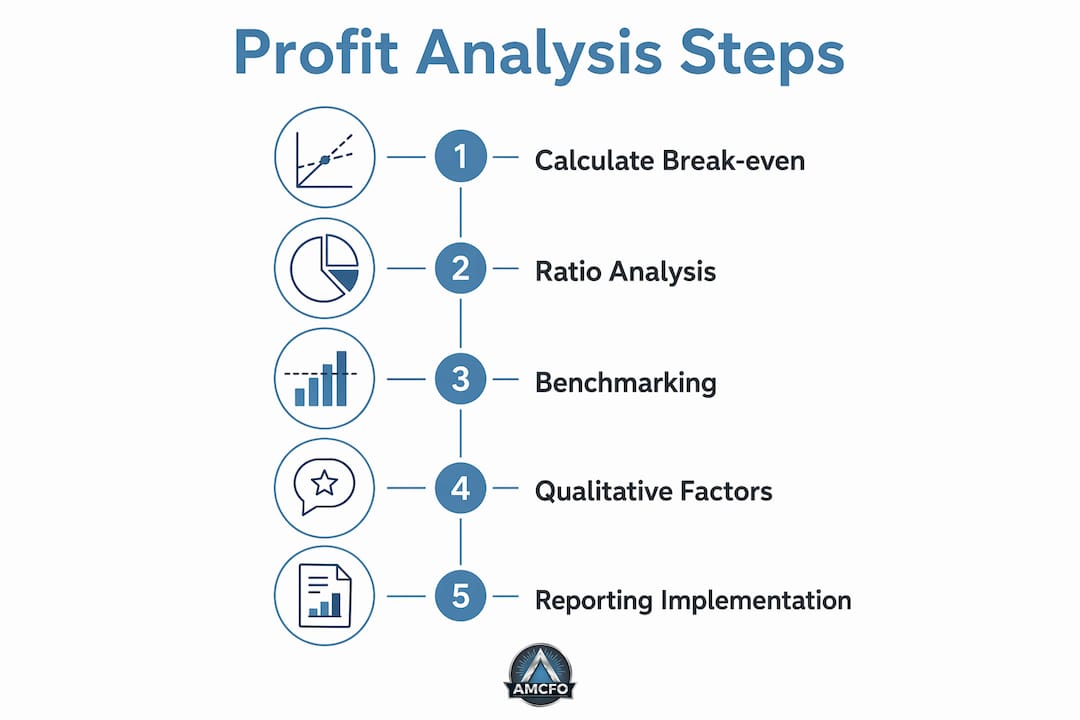
Three core steps in profit analysis are break-even point calculations, ratio analysis, and benchmarking against industry standards. Each method answers a different question about financial performance, and using all three together gives analysts a complete picture.
Break-even analysis
Break-even analysis identifies the exact sales volume at which revenue covers all costs. Running this calculation by product line or customer segment reveals which parts of the business are subsidizing others. A product generating $500,000 in revenue but carrying $480,000 in allocated costs is not a growth asset. It is a liability dressed up as revenue.
Margin ratio evaluation
Margin ratios translate raw dollar figures into percentages that allow comparison across time periods and competitors. Gross profit margin measures how efficiently a company produces its goods or services. Operating margin strips out non-operating income and shows the profitability of core business activities. Net profit margin reflects the bottom line after all expenses, taxes, and interest. Profitability is calculated as (Profit / Revenue) x 100, which makes margin ratios directly comparable across companies of different sizes.

Return ratios and ROE decomposition
Return on Equity (ROE) is one of the most informative return ratios available. ROE decomposition breaks profit drivers into three components: net profit margin, asset turnover, and financial leverage. This breakdown shows whether a company earns strong returns because it is genuinely profitable, because it turns assets over quickly, or because it carries significant debt. Knowing which lever drives ROE changes how a financial manager responds.
Benchmarking
Benchmarking compares internal margin ratios against industry peers and sector medians. A 12% net profit margin looks strong in isolation. Against a sector median of 18%, it signals underperformance. Benchmarking forces analysts to contextualize results rather than celebrate them in a vacuum.
The table below summarizes the key profitability metrics every analyst should track:
| Metric | Formula | What it measures |
|---|---|---|
| Gross profit margin | (Revenue minus COGS) / Revenue x 100 | Production efficiency |
| Operating profit margin | Operating income / Revenue x 100 | Core business profitability |
| Net profit margin | Net income / Revenue x 100 | Bottom-line profitability |
| Return on Equity (ROE) | Net income / Shareholders' equity x 100 | Return on invested capital |
| Break-even point | Fixed costs / (Price minus Variable cost) | Minimum sales threshold |
Pro Tip: Run margin ratio analysis on a trailing 12-month basis alongside the current period. Single-period snapshots miss seasonal distortions that can make a struggling business look healthy.
How do qualitative factors enhance profit analysis?
Profit analysis requires both quantitative and qualitative data for an accurate understanding of what drives earnings. Numbers tell you what happened. Qualitative factors tell you why, and why matters more for forward-looking decisions.
Market conditions directly affect margin ratios in ways that financial statements cannot explain on their own. A retailer showing margin compression in Q3 may be responding to a competitor's aggressive pricing campaign, not internal inefficiency. Without that context, a financial manager might cut costs in the wrong place.
Customer feedback and segmentation data reveal which customer groups generate the most profitable revenue. A segment that accounts for 30% of sales but requires disproportionate support, returns, or customization may actually destroy margin. Integrating customer lifetime value data with revenue figures gives analysts a cleaner view of true profitability by segment. Tools like financial modeling frameworks help combine market conditions, vendor relationships, and client feedback with hard financial metrics.
Vendor relationships shape cost structure in ways that do not always appear in standard cost-of-goods calculations. A supplier offering 90-day payment terms effectively provides working capital. Losing that relationship changes cash flow dynamics even if the invoice price stays the same. Analysts who track vendor terms alongside cost ratios catch these shifts before they hit the income statement.
- Market pricing pressure can compress gross margins even when internal costs are controlled
- Customer churn in high-margin segments reduces average revenue quality across the portfolio
- Vendor consolidation can lower unit costs but increase supply chain risk, which carries its own financial exposure
- Regulatory changes in a specific market can shift the cost structure for an entire product line overnight
Pro Tip: Build a qualitative checklist that runs alongside your standard ratio analysis. Include market share trends, customer satisfaction scores, and key vendor contract renewal dates. Review it every time you review the numbers.
What are common pitfalls in profit analysis?
Net profit margin is the most manipulable line on the income statement. Reported net income is susceptible to accounting choices around depreciation, revenue recognition, and one-time items. Gross profit and operating income are harder to distort and give a more reliable view of operational reality.
Stripping out non-core earnings and inflation effects produces what analysts call "core earnings." A company that reports $10 million in net income but includes $3 million from an asset sale and $1.5 million from a tax benefit is generating $5.5 million in sustainable operating profit. That distinction matters enormously for valuation and planning.
Simplistic overhead allocation is another common error. Spreading indirect costs evenly across product lines hides which products are actually profitable. Activity-Based Costing (ABC) assigns costs based on actual resource consumption, revealing hidden loss-making segments that averaged allocations obscure. A product line that appears profitable under standard allocation may be consuming 40% of customer service resources while generating 15% of revenue.
The divergence between accounting profit and cash flow is a critical blind spot. Strong reported profits do not guarantee liquidity. A business can show $2 million in net income while burning cash because of slow receivables collection or aggressive inventory buildup. Cross-checking the income statement against the cash flow statement catches this before it becomes a crisis.
The following steps reduce the most common analysis errors:
- Start with gross profit and operating income before examining net income
- Identify and exclude non-recurring items from core earnings calculations
- Apply Activity-Based Costing to any product or customer segment analysis
- Cross-check net income against operating cash flow for every reporting period
- Adjust for inflation when comparing multi-year profit figures
- Verify that revenue recognition policies have not changed between periods
How to implement profit analysis in financial reporting?
Analysis frequency should match the margin profile of the business. Businesses with thin margins should conduct profit analysis weekly to avoid cash flow crises. More stable-margin businesses can use a monthly cadence without losing visibility. The right frequency is the one that gives decision-makers enough lead time to act.
Multi-year trending of margins reveals growth quality and detects margin compression early. A business showing flat revenue but declining gross margin over three years is losing pricing power or absorbing cost increases it cannot pass on. That trend is invisible in a single-period snapshot and obvious in a five-year chart.
Vertical income statement analysis tracks profit drivers line by line, from sales through to net income. Expressing each line as a percentage of revenue makes it easy to spot where costs are growing faster than revenue. If cost of goods sold moves from 45% to 52% of revenue over two years, that is a structural problem, not a rounding error.
Combining internal metrics with external benchmarking produces the most useful insights for decision-making. Internal trends show direction. Benchmarks show position. Together, they tell financial managers whether a margin improvement is genuine progress or just keeping pace with a rising tide. Amcfo's efficiency and cost analysis frameworks apply exactly this combination for clients across industries.
| Implementation practice | Recommended cadence | Primary output |
|---|---|---|
| Margin ratio review | Monthly or weekly | Trend report by segment |
| Break-even recalculation | Quarterly or on cost change | Updated pricing floor |
| Benchmarking comparison | Semi-annually | Competitive position report |
| Cash flow vs. profit reconciliation | Monthly | Liquidity risk flag |
| Core earnings adjustment | Quarterly | Sustainable profit figure |
ERP systems like SAP and Oracle, and business intelligence tools like Microsoft Power BI and Tableau, automate data aggregation and visualization. They reduce the time analysts spend pulling numbers and increase the time available for interpretation. Interpretation is where the value is.
Key Takeaways
Effective profit analysis combines quantitative rigor with qualitative context, and no single metric tells the full story without cross-checking against cash flow, cost structure, and market conditions.
| Point | Details |
|---|---|
| Use multiple margin metrics | Gross, operating, and net margins each reveal a different layer of profitability. |
| Apply Activity-Based Costing | ABC exposes hidden loss-making segments that averaged overhead allocation conceals. |
| Cross-check cash flow | Strong net income does not confirm liquidity; reconcile with the cash flow statement every period. |
| Strip out non-core items | Adjust reported profits for one-time gains and inflation to identify sustainable core earnings. |
| Match analysis frequency to margin stability | Thin-margin businesses need weekly analysis; stable-margin businesses can use monthly reviews. |
Why headline profit figures deserve more skepticism
Financial managers often inherit a culture that treats net income as the definitive measure of business health. I have seen that assumption cause real damage. A company I worked with reported three consecutive years of net income growth while its operating cash flow was declining. The income growth came from favorable depreciation schedules and a series of asset disposals. The underlying business was shrinking. No one caught it because the team stopped at the headline number.
The most important shift I have made in my own practice is treating net income as a starting point, not a conclusion. Gross profit and operating income are harder to manipulate and closer to the truth of what a business actually does. When those two metrics diverge from net income, something needs explaining.
Qualitative context is not a soft addition to real analysis. It is the difference between knowing that margins dropped and knowing what to do about it. A margin decline driven by a temporary commodity spike requires a different response than one driven by a structural shift in customer buying behavior. The numbers cannot tell you which one you are facing. Market intelligence, customer data, and vendor conversations can.
The analysts who produce the most useful financial performance analysis are not the ones who run the most complex models. They are the ones who ask the most uncomfortable questions about what the numbers are not showing.
— Angelica
How Amcfo supports deeper profitability assessment
Amcfo provides fractional CFO services, accounting, and bookkeeping designed for businesses that need more than accurate books. They need to understand what the numbers mean.

Amcfo's team applies the full range of fractional CFO services to profitability assessment, including core earnings adjustments, Activity-Based Costing analysis, and margin trend reporting. For businesses managing thin margins or complex cost structures, that level of analysis is the difference between reacting to problems and preventing them. Amcfo works with companies across industries to build financial reporting that supports real decisions, not just compliance. Learn more about accounting and bookkeeping services built around accurate, decision-ready financial data.
FAQ
What is profit analysis in financial management?
Profit analysis is the process of evaluating a company's revenue and costs to measure true profitability. It uses margin ratios, break-even calculations, and benchmarking to support financial decision-making.
What is the difference between gross profit and net profit margin?
Gross profit margin measures production efficiency by comparing revenue to the cost of goods sold. Net profit margin reflects the bottom line after all expenses, taxes, and interest, and is more susceptible to accounting adjustments.
How often should a business conduct profit analysis?
Businesses with thin margins should run profit analysis weekly to catch cash flow risks early. More stable-margin businesses can use a monthly cadence without losing meaningful visibility.
What is Activity-Based Costing and why does it matter?
Activity-Based Costing assigns indirect costs based on actual resource consumption rather than averaged allocation. It reveals which products or customer segments are genuinely profitable and which are loss-making under standard overhead methods.
How does cash flow relate to reported profit?
A business can report strong net income while experiencing a cash shortage due to slow receivables or inventory buildup. Cross-checking the income statement against the cash flow statement every reporting period is the standard check for this risk.