

Gross margin measures how much revenue remains after paying direct production costs. Net margin measures what's left after every cost, including overhead, interest, and taxes. Those two sentences capture the entire difference, but the gap between them, is where most business owners get into trouble.
The formulas:
Gross Margin % = (Revenue − COGS) ÷ Revenue × 100
Net Margin % = Net Income ÷ Revenue × 100
Quick example: A business with revenue significantly higher than its direct costs produces a gross margin well above net margin, illustrating how overhead, interest, and taxes reduce overall profitability.

TL;DR: Use gross margin to evaluate pricing power and production efficiency. Use net margin to judge whether the whole business is actually profitable after everyone gets paid, including the IRS.
Gross margin focuses on production efficiency while net margin measures overall profitability after all expenses. Gross margin is always the larger of the two numbers. Owners who watch only gross margin can be genuinely surprised when overhead or financing costs erase what looked like a healthy production-level profit.

Table of Contents
- What gross margin actually measures
- How to calculate gross margin step by step
- What net margin (net profit margin) measures
- How to calculate net margin from gross profit
- Gross margin vs net margin: a side-by-side comparison
- What counts as a "good" margin, and why it depends on your industry
- How owners and managers actually use these metrics
- How to improve gross margin and net margin
- When it's time to bring in professional help
- Key Takeaways
- The margin mistake most owners don't catch until it's expensive
- Amcfo helps you see the full margin picture
- Useful sources
What gross margin actually measures
Gross margin is gross profit expressed as a percentage of net sales. It sits on the income statement as a mid-statement subtotal, after COGS and before operating expenses. The formula in dollar terms: Gross Profit = Net Sales − COGS. As a percentage: Gross Margin % = Gross Profit ÷ Net Sales × 100.
What counts as COGS depends on your business model:
- Product businesses: raw materials, freight-in, direct manufacturing labor, packaging, and inventory write-downs tied to production.
- Service businesses: direct labor of billable staff (the hours your team spends delivering the service), subcontractors, and job-specific supplies.
- SaaS and digital products: hosting costs, payment processing fees, and customer support labor directly tied to delivering the product.
The most common misclassification is direct labor. In service firms, direct labor is COGS — not an operating expense. Booking it under SG&A inflates gross margin and hides the true cost of delivery. The result looks like a pricing win when it's actually a bookkeeping error.
A high gross margin signals pricing power and production efficiency. A declining gross margin, even when revenue is growing, usually means either prices are under pressure or direct costs are rising faster than the business can absorb them. Analysts watch gross margin as an early warning system for exactly that reason.
How to calculate gross margin step by step
The calculation is straightforward. Where owners go wrong is usually in what they include in COGS, not in the arithmetic itself.
- Start with gross (total) sales. Pull this from your income statement or accounting software.
- Subtract sales returns, allowances, and discounts to get net sales. This is your denominator.
- Identify all COGS. For product businesses, this is inventory cost of goods sold. For service businesses, include all direct labor and job-specific costs.
- Subtract COGS from net sales to get gross profit in dollars.
- Divide gross profit by net sales and multiply by 100 to get gross margin percentage.
| Business Type | Revenue | COGS | Gross Profit | Gross Margin % |
|---|---|---|---|---|
| Retail (apparel) | Moderate revenue and costs typical of retail | Substantial direct costs of goods sold | Moderate gross profit typical of retail | Retail gross margins typically run 10–30% |
| SaaS / digital product | Revenue characterized by low marginal costs | Lower direct costs reflecting digital delivery | Higher gross profit typical of SaaS | SaaS gross margins often exceed 70% |
| Professional services | Revenue from labor-intensive services | Direct labor and job-related expenses | Higher gross profit indicative of service models | Professional services typically show gross margins of 20–50% |
Two practical checks before you trust the number: verify that sales returns are deducted from gross sales (not buried in operating expenses), and confirm your inventory valuation method is consistent period over period. Switching between FIFO and weighted average mid-year will shift COGS and distort the comparison.
Pro Tip: If your gross margin swings more than 3–5 percentage points between comparable periods with no obvious pricing change, check for misclassified costs first. A reclassified expense line is almost always faster to find than a pricing problem.
What net margin (net profit margin) measures
Net margin, also called net profit margin or return on sales, is the bottom-line profitability metric. Net income divided by revenue gives you the percentage of each revenue dollar the business actually keeps after every obligation is met.
Every expense category between gross profit and net income reduces this number:
- Selling, general, and administrative expenses (SG&A): salaries of non-production staff, rent, utilities, insurance, marketing spend.
- Depreciation and amortization (D&A): the non-cash cost of using long-term assets and intangibles over time.
- Interest expense: the cost of carrying debt, whether a business line of credit, equipment loan, or SBA loan.
- Income taxes: federal, state, and local taxes on taxable income.
- Non-operating items: gains or losses on asset sales, foreign exchange impacts, and similar one-time events.
- One-time charges: restructuring costs, legal settlements, or write-offs that don't recur.
Analysts and lenders prefer net margin when they want to evaluate the whole business, not just the production engine. A company with a 60% gross margin and a 2% net margin has a serious overhead or financing problem. Net margin is what tells you that. For profitability ratios in investor analysis, net margin is typically the primary metric because it reflects what shareholders actually earn per dollar of revenue.
How to calculate net margin from gross profit
The path from gross profit to net income follows a fixed sequence. Understanding each step prevents the most common owner mistake: treating gross profit as available cash.
- Start with gross profit (from the gross margin calculation above).
- Subtract total operating expenses (SG&A, marketing, R&D if applicable). This gives you operating income, also called EBIT.
- Subtract interest expense on all outstanding debt.
- Subtract depreciation and amortization if not already captured in operating expenses.
- Subtract estimated income taxes. Use your effective tax rate, not the statutory rate, for accuracy.
- Add or subtract non-operating items (asset sale gains, one-time charges).
- The result is net income. Divide by revenue and multiply by 100 for net margin %.
Worked example (continuing from the gross margin section):
| Line Item | Amount |
|---|---|
| Revenue | $500,000 |
| Gross Profit | $200,000 (40%) |
| SG&A | $80,000 |
| Depreciation | $20,000 |
| Operating Income | $100,000 |
| Net Income | $50,000 |
| Net Margin | 10% |
Pro Tip: Interim financial statements that ignore estimated taxes can create phantom profitability. If you're reviewing monthly P&Ls without a tax reserve, your net margin looks better than it actually is. Reserve an estimated tax amount each month so you're not surprised at year-end.
Gross margin vs net margin: a side-by-side comparison
| Dimension | Gross Margin | Net Margin |
|---|---|---|
| What it measures | Production and pricing efficiency | Overall business profitability |
| Formula | (Revenue − COGS) ÷ Revenue × 100 | Net Income ÷ Revenue × 100 |
| Costs included | COGS only (direct materials, direct labor, freight-in) | COGS + SG&A + D&A + interest + taxes + one-time items |
| Typical decisions it informs | Pricing strategy, supplier negotiations, product mix | Owner distributions, investor reporting, loan covenants |
| Example (from above) | Gross profit divided by revenue illustrates gross margin | Net income divided by revenue illustrates net margin |
| Benchmark range (varies by industry) | Gross margins typically range from 10–30% in retail, can exceed 70% in SaaS; professional services show 20–50% | Net margins typically range from 5–20%, varying by industry |
| How to improve | Lower COGS, raise prices, optimize product mix | Reduce overhead, refinance debt, control SG&A |
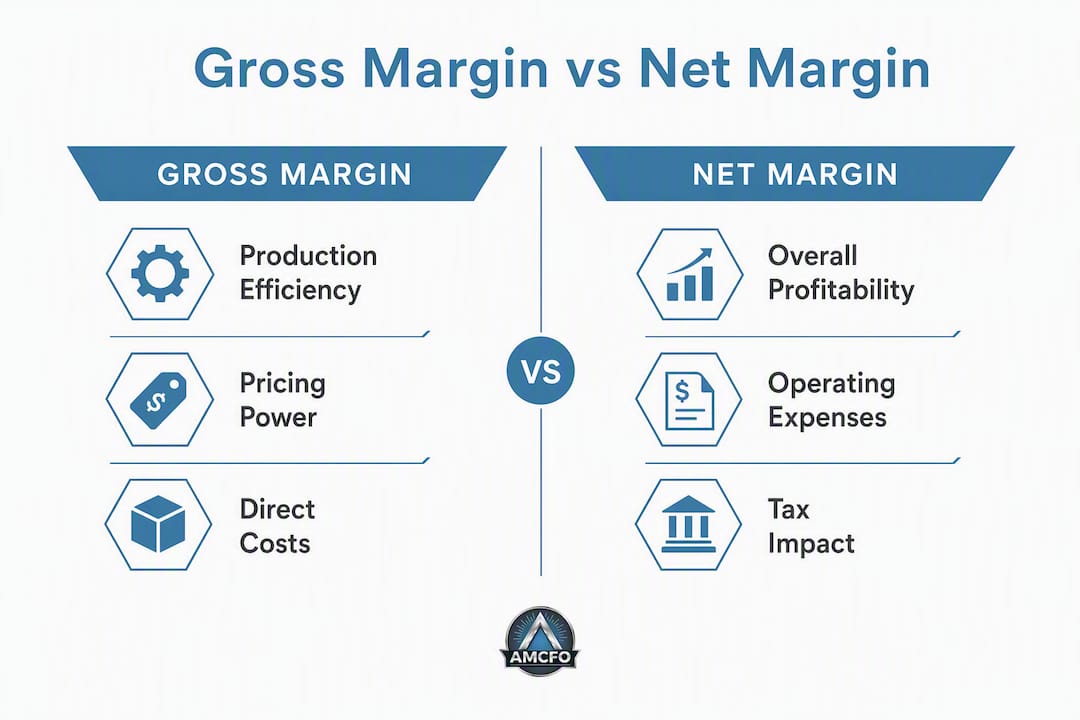
The one-paragraph verdict: gross margin is the right metric when you're making decisions about pricing, sourcing, or product design. Net margin is the right metric when you're deciding whether the business is generating real wealth for its owners or just covering its own costs. A business can have an excellent gross margin and a terrible net margin. The reverse is nearly impossible, which is why gross margin is always the larger number.
What counts as a "good" margin, and why it depends on your industry
There's no universal answer, and any benchmark you apply without knowing your industry peer group is likely to mislead you. Comparing margins across companies only makes sense within the same industry because capital intensity and cost structure vary too widely.
That said, here are realistic ranges by business model:
- Retail (physical products): gross margins tend to be moderate, while net margins are generally slim due to structural cost factors.
- SaaS and digital products: gross margins are usually high owing to low marginal costs; net margins vary due to significant sales and marketing expenses.
- Professional services: gross margins are often solid when direct labor is properly accounted for; net margins vary with overhead and compensation.
- Manufacturing: gross margins are moderate and net margins often reduced by capital costs and depreciation.
A large gap between gross and net margin is a classic signal worth investigating. It usually points to one of three things: excessive overhead relative to revenue, high interest expense from debt-heavy financing, or heavy marketing spend that hasn't yet converted to revenue. Fixing net margin in that situation often requires both operational changes and financing adjustments, not just a cost-cutting pass.
Service firms tend to show higher gross margins than retailers, but that doesn't mean they're more profitable overall. Labor-intensive service businesses can have high gross margins and thin net margins when management layers, benefits, and office costs pile up. The margin of safety concept from investment analysis applies here too: how much cushion does the business have between gross profit and the break-even point on net income?
How owners and managers actually use these metrics
Gross margin and net margin aren't just reporting metrics. They drive specific decisions at every stage of a business.
- Pricing decisions: gross margin is the primary input. If a product line's gross margin falls below your target, you either raise prices, cut COGS, or discontinue the line. Net margin doesn't help here because it mixes in costs you can't change at the product level.
- Supplier and sourcing negotiations: a 2-point improvement in gross margin on $1 million in revenue is $20,000 in additional gross profit. That math makes supplier negotiations concrete and worth the effort.
- Loan covenant monitoring: lenders often set minimum net margin or EBITDA thresholds in loan covenants. Net profit margin is commonly used in loan and investor assessments as a measure of debt serviceability.
- Investor updates: investors want net margin because it reflects what the business earns after all obligations. Gross margin alone can look impressive while the business bleeds cash.
- Budgeting and forecasting: gross margin drives revenue-side budgets (how much can we spend on COGS and still hit our targets?). Net margin drives owner distributions and reinvestment decisions.
- Internal performance monitoring: tracking gross margin by product line, service type, or customer segment reveals which parts of the business are subsidizing which. That analysis is harder to do at the net margin level.
When communicating margins to non-financial stakeholders, keep it simple. Gross margin percentage tells the team how efficiently they're delivering. Net margin percentage tells ownership how much the business actually earned. Both numbers in one sentence cover the conversation. For a deeper look at profit analysis methods that go beyond these two metrics, the framework expands into contribution margin, EBITDA, and segment-level analysis.
How to improve gross margin and net margin
Improving margins requires knowing which lever to pull. Gross margin and net margin respond to different actions.
Improving gross margin
- Renegotiate supplier contracts. Even a 3–5% reduction in material costs flows directly to gross profit.
- Audit your product or service mix. Low-margin SKUs or service lines drag the average down. Identify them and either reprice or phase them out.
- Review direct labor allocation. Are all billable hours correctly classified as COGS? Misclassified labor inflates gross margin and hides delivery inefficiency.
- Raise prices selectively. Price increases on high-demand products or services with inelastic demand improve gross margin without volume loss.
- Reduce waste and scrap. For manufacturers, waste reduction is a direct COGS reduction.
Improving net margin
- Cut fixed overhead that doesn't scale with revenue (excess office space, redundant software subscriptions, underutilized staff).
- Refinance high-interest debt. A 2-point reduction in interest rate on a $500,000 loan saves $10,000 annually in pre-tax income.
- Optimize marketing ROI. Track cost per acquired customer and cut channels that don't convert.
- Control payroll and benefits creep. Headcount additions that don't generate proportional revenue compress net margin fast.
One tradeoff owners consistently underestimate: cutting COGS aggressively can damage product quality or service delivery, which eventually hits revenue. A 5-point gross margin improvement that causes a 10-point revenue decline is a bad trade-off. Similarly, slashing marketing spend to improve net margin in the short term can hollow out the pipeline. The goal is sustainable margin improvement, not a one-quarter cosmetic fix. For a business profitability analysis that accounts for these tradeoffs, the framework needs to include both margin metrics alongside revenue growth rate and customer retention.
When it's time to bring in professional help
Some margin problems are calculation problems. Others are structural. Knowing the difference is where a fractional CFO earns their fee.
Signs you've moved past the DIY stage:
- Net margin is declining while gross margin is stable. This points to overhead or financing issues that require a detailed cost structure review, not just a tighter budget.
- Gross margin varies significantly between periods with no obvious pricing or volume explanation. This usually means COGS classification is inconsistent or inventory valuation is off.
- You're growing revenue but not profitability. Scaling a broken cost structure makes the problem bigger, not smaller.
- You're preparing for a loan, investment round, or acquisition. Lenders and investors will scrutinize both margins. Presenting clean, correctly classified numbers is non-negotiable.
- Cash flow doesn't match reported net income. This is a red flag that may warrant forensic accounting to identify where the discrepancy originates.
What a fractional CFO engagement typically delivers in this context: a clean classification of COGS versus operating expenses, a margin driver analysis that identifies which products or services are pulling the average down, a budget and forecast built on realistic margin assumptions, and ongoing reporting that gives ownership a clear view of both metrics every month. Amcfo's fractional CFO services are structured for exactly this kind of engagement, whether you need a one-time cleanup or ongoing advisory.
This article provides general financial information, not professional accounting or tax advice. Consult a qualified CPA or financial advisor to confirm how these concepts apply to your specific business.
Key Takeaways
Gross margin measures production efficiency; net margin measures total business profitability, and the gap between them reveals where overhead, debt, or inefficiency is consuming your earnings.
| Point | Details |
|---|---|
| Two formulas, two purposes | Gross margin = (Revenue − COGS) ÷ Revenue; net margin = Net Income ÷ Revenue. |
| COGS classification matters | Misclassifying direct labor as SG&A inflates gross margin and hides true delivery costs. |
| Benchmarks are industry-specific | Retail gross margins typically run 10–30%; SaaS gross margins often exceed 70%; professional services typically show gross margins of 20–50%. Never benchmark across industries. |
| A large gross-to-net gap is a warning | Excessive overhead, high interest, or heavy marketing spend typically explains the spread. |
| Amcfo for margin clarity | Amcfo's fractional CFO and bookkeeping services help owners calculate, interpret, and improve both margins with accurate financial reporting. |
The margin mistake most owners don't catch until it's expensive
Most business owners I work with understand gross margin intuitively. They know their product costs something to make and that the difference between price and cost is what they have to work with. What trips them up is the assumption that a healthy gross margin means the business is healthy.
It doesn't. A 50% gross margin on $1 million in revenue gives you $500,000 in gross profit. If your SG&A is $350,000, your interest expense is $80,000, and your tax bill is $25,000, you're left with $45,000 in net income. That's a 4.5% net margin. The business is technically profitable, but the owner is working full-time for a 4.5% return on revenue. That's not a pricing problem. It's a cost structure problem, and gross margin alone will never show it to you.
The other recurring issue: owners who review monthly P&Ls without tax reserves see net margins that look 30–40% better than reality. They make distribution decisions, hiring decisions, and investment decisions based on phantom profitability. By the time the tax bill arrives, the cash is gone.
My practical advice: run both metrics every month, side by side. If the gap between gross and net margin is widening over time, that's your early warning. Don't wait for year-end to investigate it.
Amcfo helps you see the full margin picture
Most businesses have the revenue data. What they're missing is the clean, correctly classified financial reporting that makes gross margin and net margin numbers trustworthy enough to act on.

Amcfo provides accounting and bookkeeping that ensures your COGS and operating expenses are classified correctly from the start, so your margins reflect reality rather than a bookkeeping convention. Beyond the books, Amcfo's fractional CFO service delivers margin driver analysis, budgeting, forecasting, and ongoing advisory tailored to your business model. Whether you need a one-time cleanup or a monthly CFO relationship, the engagement starts with getting the numbers right. Review Amcfo's service and accounting packages to find the right fit for your business.
Useful sources
- Gross Margin vs. Net Margin — Investopedia: Accessible overview of both metrics with guidance on industry-specific benchmarking.
- Gross Margin: Definition, Example, Formula — Investopedia: Detailed gross margin formula, examples, and explanation of what a higher gross margin signals about a business.
- Understanding Net Profit Margin — Investopedia: Full definition of net profit margin, its formula, and how investors use it to assess financial health.
- Net Profit Margin Calculator — BDC: Interactive calculator plus guidance on how lenders and investors apply net margin in credit and investment decisions.
- Gross margin — Wikipedia: Reference definition and historical context for gross margin as a financial metric.