

Financial analysis is defined as the systematic evaluation of financial data to assess a company's performance, profitability, cash flows, and risk for informed decision-making. It draws on financial statements, ratios, and supplementary disclosures to interpret past results and project future outcomes. Whether you are an investor weighing a stock, a lender assessing creditworthiness, or a manager planning next year's budget, financial analysis is the process that turns raw numbers into clear answers. Amcfo uses this process daily to help businesses of all sizes understand where they stand and where they are headed.
What is financial analysis and why does it matter?
Financial analysis is a systematic and evaluative process that assesses performance, stability, and profitability consistently across periods. The word "systematic" is doing real work here. Ad-hoc number-checking is not financial analysis. A proper analysis follows a defined framework, examines multiple data sources, and produces conclusions tied to a specific decision.
The importance of financial analysis shows up in three distinct contexts. External investors use it to decide whether a company is worth buying. Lenders use it to decide whether a borrower can repay. Internal managers use it to allocate resources, set budgets, and measure performance against targets. Each context demands a different emphasis, but all three rely on the same underlying data: the income statement, the balance sheet, and the cash flow statement.
Financial analysis also separates reporting from insight. Reporting tells you what happened. Analysis tells you what it means and what to do next. A company can post rising revenue and still be heading toward a cash crisis. Only a proper analysis, one that examines cash flow patterns alongside the income statement, will catch that contradiction early.
What are the main types and methods of financial analysis?
Financial analysis uses several distinct methods, and choosing the right one depends on the question you are trying to answer.

Ratio analysis is the most widely used technique. Ratios like the current ratio, quick ratio, and turnover ratio standardize financial metrics so you can compare them across periods, competitors, and industry benchmarks. Ratios fall into four families: liquidity (can the company pay short-term bills?), profitability (is the company generating returns?), solvency (can it survive long-term?), and efficiency (how well does it use its assets?).
Vertical and horizontal analysis add context that ratios alone cannot provide. Vertical analysis expresses every line item as a percentage of a base figure, such as revenue, so you can see the cost structure at a glance. Horizontal analysis tracks the same line items across multiple periods to reveal trends. Used together, they show both the shape of the business and the direction it is moving.
| Analysis type | Primary question | Best used for |
|---|---|---|
| Ratio analysis | How does performance compare? | Benchmarking, credit assessment |
| Vertical analysis | What is the cost structure? | Margin review, budget setting |
| Horizontal analysis | How has performance changed? | Trend detection, forecasting |
| Cash flow analysis | Is cash generation healthy? | Liquidity and solvency review |
| Leverage analysis | How much debt is the business carrying? | Risk assessment, lending decisions |
Pro Tip: Group your ratios by the decision you are trying to make before you start calculating. Ratio families aligned with specific goals prevent unfocused "ratio hunting" and keep your analysis relevant to the actual question at hand.
How do financial analysts interpret financial statements and disclosures?
The three core financial statements work as a system, not as independent documents. The income statement shows revenue and expenses over a period. The balance sheet shows assets, liabilities, and equity at a point in time. The cash flow statement reconciles net income with actual cash movement. A ratio pulled from just one of these statements tells an incomplete story.
Professional financial analysis requires examining disclosures alongside the core statements. These disclosures include:
- Audit reports: Confirm whether the statements are free from material misstatement and flag any going-concern warnings.
- Footnotes: Explain accounting policy choices that directly affect reported numbers, such as depreciation methods or revenue recognition timing.
- Management commentary (MD&A): Provides context for results, including management's own assessment of risks and opportunities.
Ignoring these disclosures leads to misleading conclusions. A company might show a strong current ratio, but a footnote could reveal that a large portion of current assets is slow-moving inventory. That single detail changes the liquidity picture entirely.
Historical trends matter, but projections matter more for forward-looking decisions. Analysts use multi-period comparisons to identify whether a trend is accelerating, plateauing, or reversing. Multi-period ratio analysis paired with disclosure review helps detect early warning signs and provides a more reliable basis for forecasts.
Pro Tip: Triangulate every ratio with the cash flow statement and the relevant footnote before drawing a conclusion. A ratio that looks alarming in isolation often has a straightforward explanation in the disclosures, and vice versa.
What are the practical applications and benefits of financial analysis?
Financial analysis drives better budgeting and forecasting by giving planning teams an accurate picture of the company's current financial position. Without that foundation, budgets are guesses and forecasts are fiction.
The practical applications span both internal and external decisions:
- Budgeting and forecasting: Analysis of historical margins and cost trends feeds directly into realistic forward projections.
- Performance measurement: Comparing actual results against budgeted figures, and against prior periods, shows where the business is outperforming or falling short.
- Investment decisions: Internal teams use projected cash flows to evaluate whether to buy equipment, expand a facility, or launch a new product line.
- Lending and credit decisions: Banks and creditors use solvency and liquidity ratios to set loan terms and credit limits.
- Risk detection: Declining interest coverage ratios or deteriorating working capital are early signals of financial stress, visible only through consistent analysis.
- Resource allocation: Profitability analysis by product line or business unit shows where capital generates the best return.
Financial analysis supports both external investors and internal decision-makers, with the key difference being the time horizon and the type of decision being made. External investors focus on valuation and return. Internal managers focus on operational performance and resource use.
AI-assisted analysis tools are changing the speed at which large data sets get processed. They surface patterns across thousands of data points faster than manual review. The interpretation of those patterns, and the judgment calls that follow, still require human expertise and contextual knowledge. For most businesses, the bigger opportunity is not AI. It is getting the fundamentals right: clean books, consistent accounting policies, and a regular analysis cadence. Amcfo's financial consulting services are built around exactly that foundation.
What are common challenges in performing financial analysis?
Financial analysis is not a mechanical process. Several pitfalls can undermine even a well-structured review.
Ratio analysis has real limits. Ratio analysis highlights potential problems but does not prove them. A single ratio is a flag, not a verdict. Treating it as a verdict leads to wrong conclusions and poor decisions.
Accounting policy differences distort comparisons. Two companies in the same industry can report very different gross margins simply because they use different inventory valuation methods or depreciation schedules. Comparing their ratios without adjusting for these differences produces a false picture.
| Challenge | Why it matters | How to address it |
|---|---|---|
| Overreliance on a single ratio | Misses the full financial picture | Use ratio families, not individual metrics |
| Accounting policy differences | Distorts peer comparisons | Adjust for policy differences before comparing |
| Historical data bias | Past performance may not predict future results | Pair historical analysis with forward projections |
| Missing disclosure context | Ratios can mislead without footnote explanation | Always read footnotes and MD&A alongside ratios |
| Industry context gaps | Benchmarks vary widely by sector | Compare against sector-specific norms |
Contextualizing performance against industry norms is non-negotiable. A debt-to-equity ratio that signals danger in a retail business is perfectly normal in a capital-intensive utility. Without the right benchmark, the number means nothing. Interpretation across financial reports provides deeper insight into business health than any single metric can.
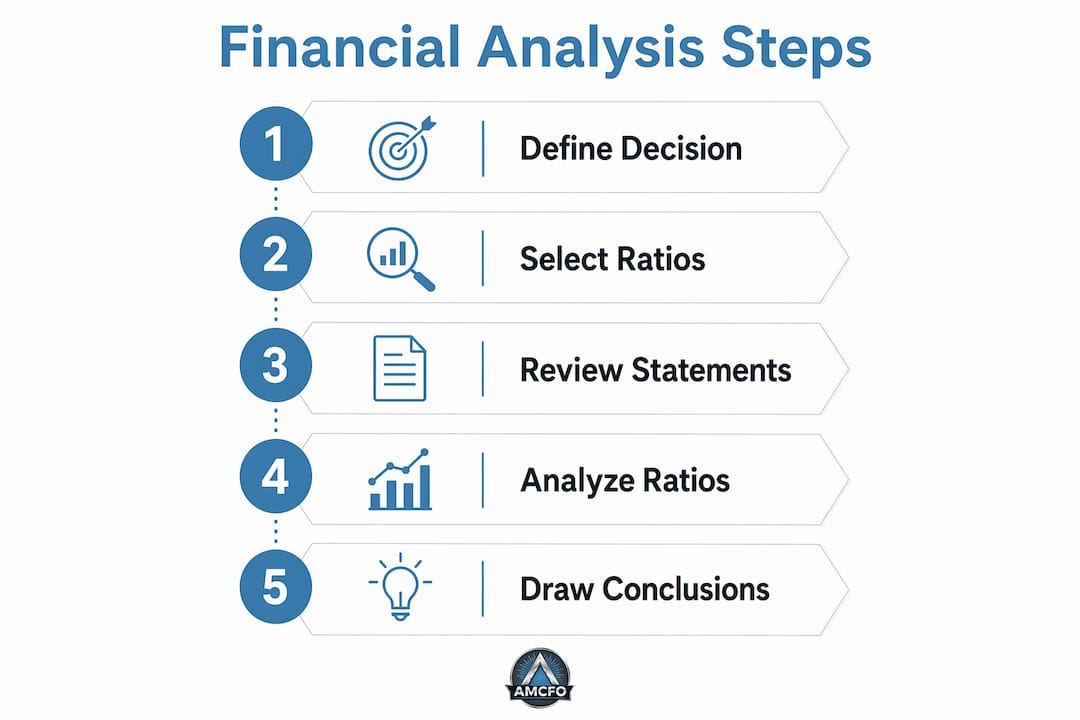
A systematic framework solves most of these problems. Define the decision first, select the relevant ratio families, review the supporting disclosures, and compare against the right benchmark. That sequence keeps analysis focused and conclusions defensible. Amcfo's approach to efficiency and cost analysis follows this exact structure for every client engagement.
Key Takeaways
Financial analysis is the systematic process of evaluating financial statements, ratios, and disclosures to assess performance, detect risk, and guide investment, lending, and operational decisions.
| Point | Details |
|---|---|
| Definition of financial analysis | It is a systematic evaluation of financial data covering performance, profitability, cash flows, and risk. |
| Core methods | Ratio, vertical, horizontal, cash flow, and leverage analysis each answer a different question. |
| Disclosures are not optional | Footnotes, audit reports, and MD&A are required reading to avoid misleading ratio interpretations. |
| Decision-driven framework | Group ratios by the decision you are making to keep analysis focused and avoid ratio hunting. |
| Analysis vs. reporting | Reporting describes what happened; analysis explains what it means and what action to take. |
Financial analysis is more than a numbers exercise
I have reviewed hundreds of financial reports across industries, and the most common mistake I see is not a math error. It is treating financial analysis as a reporting task rather than a thinking task. Analysts calculate a current ratio, see that it is above 1.0, and move on. They never ask whether the receivables in that ratio are actually collectible, or whether the inventory is actually sellable.
The narrative disclosures, the MD&A, the footnotes, the auditor's language, these are where the real story lives. I have seen companies with textbook-perfect ratios that were quietly deteriorating because management commentary revealed a customer concentration risk that no ratio captures. And I have seen businesses with ugly short-term ratios that were actually healthy because the cash flow statement showed strong operating cash generation.
The future of financial analysis will involve more automation and AI-assisted pattern recognition. That is real and worth paying attention to. But the judgment layer, the part where you decide what a pattern means for a specific business in a specific market, will remain a human skill for the foreseeable future. The professionals who will thrive are those who use AI to process data faster and spend the time saved on deeper interpretation. That combination, speed plus judgment, is what financial modeling for business decisions looks like at its best.
— Angelica
How Amcfo supports expert financial analysis for your business
Accurate financial analysis starts with accurate books. If your underlying data is inconsistent or incomplete, no analytical framework will save you.

Amcfo provides bookkeeping, accounting, and fractional CFO services that give businesses the clean financial foundation analysis requires. From QuickBooks setup and cleanup to budgeting, forecasting, and ongoing CFO consulting, Amcfo builds the systems that make financial analysis reliable and repeatable. Whether you need monthly reporting reviewed by an expert or a full strategic financial review, Amcfo tailors its services to your business's size and goals. Good analysis is only as good as the data behind it.
FAQ
What is the definition of financial analysis?
Financial analysis is the systematic evaluation of financial data, including statements, ratios, and disclosures, to assess a company's performance, profitability, and risk. Its purpose is to support informed decisions by investors, lenders, and managers.
What are financial ratios and why do they matter?
Financial ratios are standardized metrics calculated from financial statement data that allow comparison across periods, competitors, and industry benchmarks. They fall into four families: liquidity, profitability, solvency, and efficiency.
How do you perform financial analysis step by step?
Start by defining the decision you need to make, then select the relevant ratio families, review the income statement, balance sheet, and cash flow statement together, and read all supporting disclosures before drawing conclusions.
What is the importance of financial analysis for decision-making?
Financial analysis converts raw financial data into insight that drives budgeting, investment, lending, and resource allocation decisions. Without it, business decisions rely on incomplete information and intuition rather than evidence.
What are the most common mistakes in financial analysis?
The most common mistakes are overrelying on a single ratio, ignoring footnotes and MD&A, and comparing ratios across companies without adjusting for accounting policy differences. Each of these errors produces conclusions that look credible but are factually wrong.