

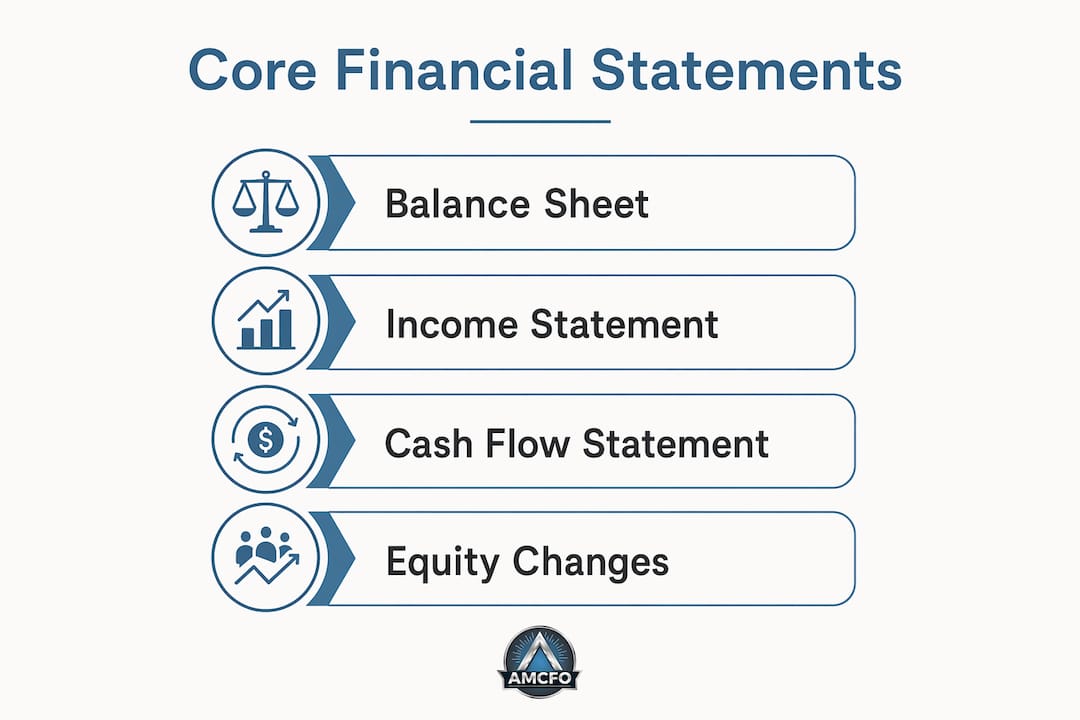
Financial reporting is the process of compiling and disclosing a company's financial statements, notes, and supplementary disclosures to investors, lenders, regulators, and management so they can assess its health, performance, and obligations. The four core outputs are the balance sheet, income statement, cash flow statement, and statement of changes in equity, often supplemented by internal dashboards and management reports.
At a glance:
- Balance sheet: what a company owns and owes at a specific date
- Income statement: revenue, costs, and profit over a period
- Cash flow statement: actual cash moving in and out, split by operating, investing, and financing activity
- Statement of changes in equity: how ownership value shifts through retained earnings, dividends, and new capital
- Internal dashboards: KPIs, forecasts, and segment views tailored to management
The single most important thing to understand about financial reporting: it creates one version of truth that lets every stakeholder, from a lender checking debt covenants to a CEO planning next quarter's hiring, answer the same question from the same data.
Table of Contents
- Why financial reporting matters for investors, lenders, regulators, and managers
- The four core financial statements: what each shows and the key lines to read
- External vs. internal reporting: what's the difference and why it matters
- Who uses financial reports and how each stakeholder applies the information
- How financial reporting is produced: the reporting cycle step by step
- US reporting standards, required filings, and compliance basics
- Key financial metrics and how to read statements together
- Practical tools and the shift from spreadsheets to integrated reporting
- When to get professional help with financial reporting
- Key Takeaways
- Financial reporting as a steering tool, not just a compliance exercise
- Accurate financial reporting without the overhead of a full-time CFO
- Authoritative sources and further reading
Why financial reporting matters for investors, lenders, regulators, and managers
Financial reporting serves a different purpose depending on who is reading it, but the underlying need is always the same: reliable information to make a decision with real consequences.
External users rely on published reports to evaluate risk and value without direct access to a company's books. Investors use the income statement and cash flow statement to assess burn rate, margin trends, and whether reported profits translate into actual cash. Creditors check the balance sheet for leverage ratios and the cash flow statement to confirm the company can service debt. Regulators, including the SEC and the IRS, use filings to verify compliance with disclosure rules and tax obligations.
Internal users work with the same underlying data but need it faster and in more granular form. FP&A teams use financial reporting to maintain organized accounting data, track liabilities, and support profitability projections and financial forecasting. A CFO preparing a board deck needs segment-level margins and a rolling 13-week cash forecast, not just the annual 10-K.
Concrete use cases span the full business lifecycle:
- A bank deciding whether to extend a $5 million credit line will require audited financial statements and a debt-service coverage ratio above a set threshold.
- A private equity firm running M&A diligence will rebuild the income statement to strip out one-time items and normalize EBITDA.
- A founder raising a Series A will need clean, GAAP-compliant books before any institutional investor will sign a term sheet.
- A tax advisor preparing a corporate return depends on accurate revenue recognition and expense categorization from the books.
Standardization is what makes all of this possible. US Generally Accepted Accounting Principles (GAAP), set by the Financial Accounting Standards Board (FASB), require public companies to follow consistent rules for recognition, measurement, and disclosure, so a reader can compare one company's financials to another's without adjusting for different accounting choices.
The four core financial statements: what each shows and the key lines to read
No single statement tells the complete story. Analysts who read only the income statement miss the cash picture; those who skip the balance sheet miss the leverage. The four statements work as a system.
Balance sheet
The balance sheet is a point-in-time snapshot: assets on one side, liabilities and equity on the other, and the two sides always balance (Assets = Liabilities + Equity). Key lines to check: cash and equivalents, accounts receivable aging, inventory levels, long-term debt, and total shareholders' equity. A shrinking equity base alongside rising debt is a warning sign even when the income statement looks fine.

Income statement (P&L)
The income statement covers a period, typically a quarter or a year, and shows revenue at the top, then subtracts cost of goods sold to get gross profit, then operating expenses to get operating income, then interest and taxes to arrive at net income. Margins matter more than raw numbers. A company with $10 million in revenue and a 5% net margin is structurally different from one with the same revenue and a 25% margin, even if both report "profit."
Cash flow statement
This is the statement most readers underweight, and it is often the most revealing. A company can report profit on the income statement yet face liquidity problems that only the cash flow statement reveals. Operating cash flow strips out non-cash items like depreciation and changes in working capital to show whether the core business actually generates cash. Negative operating cash flow alongside positive net income usually means the company is booking revenue it has not yet collected.
Statement of changes in equity
Less discussed but genuinely useful, this statement tracks how equity moves between periods: net income adds to retained earnings, dividends reduce it, and new share issuances or buybacks shift the total. It is the bridge between two consecutive balance sheets.
| Statement | Question it answers | Typical frequency |
|---|---|---|
| Balance sheet | What does the company own and owe right now? | Quarterly and annual |
| Income statement | How much did it earn or lose over the period? | Quarterly and annual |
| Cash flow statement | Did it actually generate or consume cash? | Quarterly and annual |
| Statement of changes in equity | How did ownership value change? | Annual (quarterly for public companies) |
Pro Tip: When profits look strong but cash is tight, go straight to the operating section of the cash flow statement and check accounts receivable. A large receivables build-up often explains the gap.
External vs. internal reporting: what's the difference and why it matters
The distinction is not just about audience. It shapes format, timing, level of detail, and who is responsible for accuracy.
External reporting is standardized and regulated. Public US companies file a 10-Q (quarterly) and a 10-K (annual) with the SEC, both prepared under GAAP and reviewed or audited by an independent CPA firm. Private companies seeking bank financing typically provide audited or reviewed statements prepared to the same standard. The goal is comparability: a reader who has never met the management team can still evaluate the numbers because the rules are consistent.
Internal reporting is built for speed and specificity. According to industry standards, internal reporting dashboards can be customized to track KPIs, compare actual performance against budgets, and monitor specific business segments. A weekly cash report, a department-level P&L, or a rolling 90-day forecast are all internal reports. They do not need to follow GAAP formatting, but they should reconcile back to the GAAP statements or the discrepancy will create confusion at audit time.
Key differences at a glance:
- Audience: External reports serve investors, lenders, and regulators; internal reports serve management and boards.
- Standards: External reports follow GAAP (or IFRS internationally); internal reports follow whatever format management finds useful.
- Timing: External reports are quarterly or annual; internal reports can be daily, weekly, or monthly.
- Audit: External reports for public companies are audited; internal reports are not.
- Detail level: Internal reports often go deeper on segments, products, or geographies than any public filing would.
Pro Tip: Design internal dashboards so every key metric traces back to a line item in the audited statements. That single-source-of-truth discipline prevents the situation where the board deck shows one revenue number and the auditor finds another.
Who uses financial reports and how each stakeholder applies the information
Different readers extract different value from the same set of statements. Understanding who needs what prevents the common mistake of producing one-size-fits-all reports that serve nobody well.
Investors focus on valuation and growth trajectory. A venture-backed startup's investor will track monthly burn rate and runway from the cash flow statement, while a public-market analyst will model forward earnings from the income statement and compare the current price-to-earnings ratio against peers.
Lenders and creditors care about repayment capacity. A commercial bank will calculate the debt-service coverage ratio (operating income divided by total debt service) and check whether the company is in compliance with loan covenants. A single quarter of covenant breach can trigger a default clause, so lenders monitor balance sheet ratios closely.
Management and boards use reports to steer operations. A CEO reviewing a monthly close package will look at gross margin by product line, operating expense trends, and cash on hand relative to the next payroll cycle. The board uses the same data to hold management accountable and approve major capital decisions.

Tax authorities (the IRS at the federal level, state revenue agencies at the state level) use financial records to verify that reported taxable income matches the underlying transactions. Accurate books are not optional here; discrepancies between book income and tax returns trigger scrutiny.
Auditors do not use reports to make business decisions. Their job is to provide independent assurance that the statements present fairly, in all material respects, the company's financial position under GAAP. That assurance is what makes external reports credible to everyone else.
How financial reporting is produced: the reporting cycle step by step
Financial reporting is the last step in the accounting close, and the quality of the output depends entirely on the steps that precede it. Here is the typical cycle, from transaction to published statement:
- Identify and record transactions. Every sale, purchase, payroll run, and bank transfer gets recorded as a journal entry in the general ledger.
- Reconcile accounts. Bank accounts, credit cards, and intercompany balances are reconciled to catch errors, duplicates, and missing entries before the close.
- Post adjusting entries. Accruals (expenses incurred but not yet billed), prepaid amortization, and depreciation are recorded to match revenue and expenses to the correct period.
- Close the books. Revenue and expense accounts are zeroed out and the net result flows into retained earnings on the balance sheet.
- Prepare the financial statements. The four core statements are generated from the closed ledger.
- Management review. Finance leadership reviews the statements for anomalies, compares actuals to budget, and approves the package.
- External disclosure or audit. Public companies file with the SEC; private companies share with lenders or investors; auditors perform their procedures on the final package.
Financial reporting is typically the last step in the accounting close, with monthly reporting serving internal needs and quarterly or annual reporting serving external requirements. Monthly closes tend to take 5–10 business days for well-run finance teams; annual closes with audit support take longer. The most common bottlenecks are unreconciled intercompany accounts, late vendor invoices, and revenue recognition disputes that require legal or technical accounting input.
US reporting standards, required filings, and compliance basics
The US financial reporting framework rests on two pillars: GAAP and SEC oversight.
GAAP is the set of accounting principles, standards, and procedures that US companies follow when compiling financial statements. The FASB issues and updates these standards through Accounting Standards Codification (ASC) topics. Revenue recognition (ASC 606), lease accounting (ASC 842), and credit losses (ASC 326) are among the most consequential recent updates for operating businesses.
SEC filings apply to publicly traded companies. The 10-Q is filed within 40–45 days after each of the first three fiscal quarters; the 10-K is filed within 60–90 days after fiscal year-end. Both include the four financial statements, footnotes, and a Management Discussion and Analysis (MD&A) section where executives explain results and outlook in plain language. The SEC's EDGAR database makes every filing publicly searchable.
Audits, reviews, and compilations represent three levels of assurance. An audit provides the highest level: the auditor tests internal controls, verifies account balances, and issues an opinion. A review is less intensive and provides limited assurance. A compilation simply organizes management's numbers into statement format with no assurance. Lenders and investors typically require at least a review; public companies and many larger private companies require a full audit.
Sarbanes-Oxley (SOX) added a layer of internal control requirements for public companies after the accounting scandals of the early 2000s. Section 404 requires management and the external auditor to assess and report on the effectiveness of internal controls over financial reporting. Even private companies preparing for an IPO or acquisition often implement SOX-style controls in advance.
"The objective of financial statements is to provide information about the financial position, performance and changes in financial position of an enterprise that is useful to a wide range of users in making economic decisions." — IFRS Conceptual Framework for Financial Reporting
GAAP vs. IFRS: US companies follow GAAP; most of the rest of the world follows International Financial Reporting Standards (IFRS), issued by the International Accounting Standards Board (IASB). The two frameworks converge on many points but differ on inventory accounting (LIFO is allowed under GAAP, prohibited under IFRS), lease classification, and revenue recognition details. A US company with foreign subsidiaries or international investors may need to reconcile or restate under both frameworks.
Key financial metrics and how to read statements together
Ratios give numbers context. A $2 million cash balance means something very different for a company with $500,000 in monthly expenses versus one with $5 million.
Liquidity ratios measure the ability to meet short-term obligations:
- Current ratio = Current assets ÷ Current liabilities. A ratio below 1.0 means current liabilities exceed current assets, a potential cash crunch.
- Quick ratio = (Cash + Receivables) ÷ Current liabilities. Strips out inventory for a more conservative view.
Profitability ratios measure how efficiently a company converts revenue into profit:
- Gross margin = Gross profit ÷ Revenue. Shows pricing power and production efficiency.
- Operating margin = Operating income ÷ Revenue. Reflects the core business before financing costs.
- Return on equity (ROE) = Net income ÷ Shareholders' equity. Measures how effectively management uses equity capital.
Leverage ratios measure debt load:
- Debt-to-equity = Total debt ÷ Shareholders' equity. Higher ratios mean more financial risk.
- Interest coverage = Operating income ÷ Interest expense. Below 1.5x is a warning zone for most lenders.
Cash generation:
- Free cash flow = Operating cash flow minus capital expenditures. The clearest measure of cash a business generates after maintaining its asset base.
Reading statements together is where the real insight lives. Consider a company reporting $1 million in net income but negative operating cash flow of $400,000. The income statement looks healthy; the cash flow statement tells a different story. Digging into the balance sheet reveals accounts receivable grew by $1.4 million in the same period, meaning the company booked revenue it has not collected. That is a liquidity risk hiding behind a profitable income statement.
Interpretation pitfalls to watch:
- Non-cash items (depreciation, stock-based compensation) inflate operating cash flow relative to net income; check both.
- One-time gains or losses distort period-over-period comparisons; strip them out before drawing trend conclusions.
- Timing differences between revenue recognition and cash collection can make a quarter look better or worse than it actually is.
Practical tools and the shift from spreadsheets to integrated reporting
Spreadsheets are not the enemy. For a startup with 50 transactions a month, a well-structured Excel model is perfectly adequate. The problem appears when transaction volume grows, multiple people edit the same file, and version control collapses. That is when errors compound and close cycles stretch from days to weeks.
Categories of tools to consider:
- Accounting ledgers and ERP systems (QuickBooks, Xero, Sage Intacct, NetSuite): the system of record where transactions are posted and statements are generated.
- Consolidation and reporting platforms (Workiva, Vena, Planful): designed for multi-entity consolidation, SEC filing support, and audit-trail documentation.
- FP&A and forecasting tools (Adaptive Insights, Anaplan, Mosaic): connect to the ledger and layer in budgets, scenarios, and rolling forecasts.
- Dashboarding and BI tools (Tableau, Power BI, Looker): visualize ledger data for operational teams who do not read financial statements natively.
Automation of bank feeds and expense categorization allows finance teams to move from data-wrangling to data-analyzing, which drives faster, more strategic action. Linked reporting across systems eliminates reconciliation loops that slow close cycles and introduce restatement risk.
Best practices that apply regardless of tool:
- Automate bank feed imports to eliminate manual entry errors.
- Standardize the chart of accounts across all entities before adding any reporting layer.
- Enforce monthly reconciliations as a non-negotiable close gate, not an afterthought.
- Build dashboards that reconcile to the general ledger, not to a separate spreadsheet export.
For guidance on avoiding the most common missteps, the reporting mistakes founders make are well-documented and largely preventable with the right controls in place early.
When to get professional help with financial reporting
There is a point in every growing business where the cost of bad reporting exceeds the cost of fixing it. The question is whether you recognize that point before or after a lender flags a covenant breach or an investor finds a restatement.
Situations that warrant outside help:
- Books are more than two months behind, or the prior-year close has not been completed.
- Revenue recognition is complex (subscriptions, long-term contracts, milestone billing) and the current accountant is not confident in the treatment.
- The company is preparing for a fundraise, acquisition, or bank refinancing and needs clean, audited or reviewed statements.
- Covenant monitoring is manual and reactive rather than automated and forward-looking.
- The CFO role is vacant or the current finance team lacks the bandwidth for strategic analysis.
Services that address these gaps:
- Bookkeeping cleanup gets the ledger current and reconciled so the close cycle can restart cleanly.
- Monthly close support provides a repeatable process with defined owners, deadlines, and review checkpoints.
- Audit preparation organizes documentation, resolves open items, and reduces the time (and cost) of the external audit.
- Fractional CFO services add strategic capacity: cash forecasting, scenario modeling, board reporting, and covenant monitoring without the cost of a full-time executive.
A fractional CFO engagement typically starts with a diagnostic: reviewing the current close process, identifying gaps in the chart of accounts, and assessing whether the reporting package gives management the information it actually needs to make decisions. From there, the work shifts to building a repeatable monthly close, a reconciled dashboard, and a rolling cash forecast that management can act on. For small-business owners weighing their options, the financial consulting guide for small businesses walks through how to evaluate the right level of support.
Key Takeaways
Financial reporting gives every stakeholder, from investors to management, a single, reliable source of truth about a company's performance, position, and cash position.
| Point | Details |
|---|---|
| Four core statements | Balance sheet, income statement, cash flow statement, and statement of changes in equity work as a system, not in isolation. |
| Read cash flow first | When profits look strong but cash is tight, the operating section of the cash flow statement reveals the gap. |
| External vs. internal | External reports follow GAAP and are audited; internal dashboards are customized and updated more frequently. |
| Key metrics to watch | Current ratio, operating margin, debt-to-equity, and free cash flow give the clearest picture of liquidity, profitability, and leverage. |
| Amcfo's role | Amcfo provides bookkeeping cleanup, monthly close support, and fractional CFO services that improve reporting accuracy and close speed. |
Financial reporting as a steering tool, not just a compliance exercise
Most business owners treat financial reporting as something that happens after the period ends. A report lands in the inbox, someone glances at net income, and the file gets archived. That is the wrong frame entirely.
The finance professionals who get the most out of reporting use it prospectively. They read the cash flow statement before the income statement because cash is what actually funds payroll, inventory, and growth. They track operating margin by product line, not just in aggregate, because the aggregate can hide a money-losing segment that is dragging down a profitable core. And they build a rolling 13-week cash forecast that connects directly to the balance sheet so hiring and capital decisions are grounded in what the business can actually afford, not what last quarter's net income suggests.
One practical tip for any business leader: set a standing monthly meeting to review three numbers together before any other agenda item: operating cash flow, accounts receivable aging, and gross margin by segment. Those three, read in combination, will surface more early warning signs than any single metric or dashboard ever will. For a deeper look at how integrated financial planning connects reporting to strategy, the underlying principles apply whether you run a $2 million service business or a $200 million manufacturer.
The companies that use reporting well do not wait for problems to appear in the statements. They build the reporting cadence and the analytical habits that let them see problems forming, while there is still time to act.
Accurate financial reporting without the overhead of a full-time CFO
Amcfo works with businesses of all sizes that need their books clean, their close cycle reliable, and their financial reports actually useful for decisions. The concrete difference: instead of waiting until year-end to discover a revenue recognition problem or a cash shortfall, Amcfo's clients get a reconciled monthly close, a clear cash forecast, and a reporting package their lenders and investors can trust.

Services map directly to the most common reporting gaps: accounting and bookkeeping for companies whose books are behind or inconsistent, QuickBooks setup and cleanup for teams that have outgrown their current setup, payroll coordination, tax preparation support, and fractional CFO services for businesses that need strategic financial leadership without the cost of a full-time hire. If your close is taking longer than it should, your reports are not giving you the answers you need, or you are preparing for a fundraise or audit, contact Amcfo for an assessment.
Authoritative sources and further reading
The following sources informed this article and are worth consulting directly for deeper reference:
- SEC Beginners' Guide to Financial Statements: The SEC's own plain-language explanation of the four core statements, written for investors. Authoritative and free.
- SEC EDGAR: The database of all public company filings, including 10-Ks, 10-Qs, and proxy statements. Use it to read real financial statements from any public company.
- FASB Accounting Standards Codification: The primary source for US GAAP standards, including revenue recognition (ASC 606), leases (ASC 842), and credit losses (ASC 326).
- IFRS Conceptual Framework for Financial Reporting: The IASB's framework defining the objective and qualitative characteristics of financial reporting under IFRS.
- NetSuite — What Is Financial Reporting?: A practical overview of financial reporting components, the close cycle, and automation best practices.
- IBM — What Is Financial Reporting?: Covers FP&A use cases, forecasting, and how finance teams use reporting data operationally.
- Investopedia — Financial Statements Overview: Accessible definitions and examples of each statement, useful for readers building foundational knowledge.
- Workiva — Financial Statement Guidance: Focused on connected reporting, close cycle efficiency, and restatement risk reduction.
- Amcfo Financial Reporting Guide for Business Owners: Amcfo's own deep dive on reporting practices, close cycles, and what business owners should prioritize.
This article is general information about financial reporting concepts and is not a substitute for professional accounting, legal, or tax advice. Confirm current standards and requirements with a qualified CPA or your primary regulatory source for your specific situation.