

A headcount planning model is a driver-based, month-by-month spreadsheet that produces three things: an FTE roll-forward, fully-loaded payroll cost by period, and hiring timing tied to business targets. Finance uses it to build the operating budget, HR uses it to plan sourcing and offers, and hiring managers use it to time requisitions against revenue or capacity needs. Done right, it replaces reactive headcount requests with a repeatable process that ties every hire back to a number leadership already believes.
TL;DR:
- A driver-based headcount model projects roles, timing, and costs over 12 to 18 months, supporting budgets, forecasts, and leadership decisions.
- The most effective models are hybrid, using operational ratios to scale headcount, rather than top-down caps or department requests, to ensure alignment with business growth.
- Building a reliable model requires five key tabs and rigorous assumption input, including burden rates, ramp times, and attrition, with revenue ratios guiding hiring needs.
- Scenario modeling should define clear thresholds and decision triggers for upside or downside cases, influencing hiring freezes or accelerations before crises occur.
- Regular validation against actual payroll data, maintained monthly, prevents drift from reality and builds trust, especially when supported by fractional CFO services for ongoing oversight.
Table of Contents
- What Is a Headcount Planning Model, and How Does It Differ From Workforce Planning?
- Which Headcount Planning Model Fits Your Organization?
- How Do You Build a Headcount Model Step by Step?
- Turning Revenue Targets Into Actual Hiring Numbers
- How Do You Build Base, Upside, and Downside Scenarios?
- How Payroll Timing Flows Into the P&L and Cash Forecast
- Who Owns the Model, and How Often Should It Be Reviewed?
- What Does a Working Excel File Actually Look Like?
- Where Fractional CFO Support Fits Into Headcount Modeling
- The Part of Headcount Planning Everyone Underrates
- Get Help Building a Model Finance Will Actually Trust
- Sources
- FAQ
What Is a Headcount Planning Model, and How Does It Differ From Workforce Planning?
A headcount planning model is a financial and operational tool that projects the number of roles, their timing, and their fully-loaded cost across a defined horizon. Workforce planning is broader. It covers skills gaps, succession, and long-term capability building, often over three to five years. A headcount model is the tactical, budget-ready cousin: it answers "how many people, in what roles, starting when, costing how much," usually across a 12 to 18 month window.
Three horizons typically stack on top of each other:
- Annual budget: locked headcount and cost assumptions for the fiscal year, reviewed once and revised rarely.
- Rolling forecast: a 12 to 18 month view updated monthly or quarterly as actuals come in.
- Continuous rolling forecast: some FP&A teams push a perpetual 12-month window forward every month, dropping the oldest month and adding a new one.
Ownership splits cleanly when the model works well. Finance owns cost assumptions, burden rates, and how headcount ties into the P&L and cash forecast. HR owns the roster, job architecture, and compensation bands. Hiring managers supply the operational driver data, like expected ticket volume or account load, that tells the model when a role actually needs to start.
Which Headcount Planning Model Fits Your Organization?
Four approaches dominate practice, and picking the wrong one for your stage of growth is the most common reason headcount plans are ignored by leadership.
- Top-down: Finance sets a headcount envelope using ratios like revenue per employee or a percent-of-revenue payroll cap, then allocates it across departments. It is fast to build and useful for early-stage budgeting, but it is coarse. It tells you the total is $4 million in payroll, not which five roles matter most.
- Bottom-up: Each department submits its own hiring requests, justified role by role. This produces precise, defensible numbers but takes weeks to consolidate and tends to inflate, since every manager requests headcount as if their team is the priority.
- Hybrid, driver-based: Finance builds the model around operational drivers, revenue per account executive, tickets per support agent, and lets those ratios calculate the required headcount automatically. This is the version most FP&A teams should be running, because it scales with the business instead of requiring a fresh negotiation every quarter.
- Scenario-based: A base, upside, and downside case run side by side, varying growth rate, attrition, and hiring pace. This matters most when the business faces real uncertainty, a funding round, a demand shock, a new product launch, and leadership needs to see the payroll impact of each outcome before committing.
Workday's breakdown of workforce planning models adds skills-based, equilibrium, and succession variants for organizations focused on capability gaps rather than pure cost control, worth a look if your planning question is "what skills do we need" rather than "how many people can we afford."
How Do You Build a Headcount Model Step by Step?
A working model needs five tabs, in this order: Assumptions, Current Roster, Planned Hires, Monthly Summary, and Scenarios. Skipping the Assumptions tab and hard-coding rates directly into formulas is the single fastest way to make a model unmaintainable by month three.
Assumptions to capture before you build anything else:
- Fiscal year start date and reporting calendar
- Payroll tax percentage (varies depending on state and wage base)
- Benefits load as a percent of base salary, estimated as appropriate for your business
- Bonus and commission accrual rates by role type, as determined by company policy
- Time-to-fill by role band, acknowledging that senior roles generally take longer than junior roles
- Ramp time to full productivity by role, reflecting typical learning curves
- Attrition rate by department or tenure band, based on historical data
- One-time onboarding and equipment cost per hire, estimated from company records
The Roster and Planned Hires tabs need columns for role title, department, manager, base salary, planned start date, backfill-versus-net-new flag, and an active status toggle. That backfill flag matters more than it looks: without it, a departing employee and their replacement both show up as headcount additions, and your monthly numbers stop reconciling to actual payroll.
The Monthly Summary tab is where the formulas earn their keep. A practical FP&A build, as outlined in FMU University's headcount planning guide, runs on three core calculations:
| Calculation | Formula |
|---|---|
| Fully-loaded cost | Base salary × (1 + payroll tax % + benefits %) + bonus + per-hire overhead |
| Attrition | Beginning headcount × attrition % |
| Ending headcount | Beginning headcount + hires − attrition |
Prorate partial-month hires. Someone starting on the 20th does not cost a full month of salary, and skipping this step is one of the more common ways a model overstates near-term payroll expense.
Pro Tip: Build burden rates as a single assumptions cell referenced everywhere, never typed into individual formulas. When your benefits broker changes rates in January, you want to update one cell, not hunt through forty formulas.
Turning Revenue Targets Into Actual Hiring Numbers
Driver ratios are what separate a defensible model from a guess. If the business needs $10 million in new annual recurring revenue and each account executive can close $1.2 million, you need roughly 8.3 AEs, before accounting for ramp. That is the arithmetic. The judgment call is documenting the ratio itself: is $1.2 million a first-year quota or a mature-rep number?
Ratios worth tracking depending on function:
- Revenue per account executive (sales capacity)
- ARR per customer success manager (retention capacity)
- Tickets per support agent (service capacity)
- Deals sourced per SDR (pipeline capacity)
Ramp time changes the math meaningfully. Greenhouse's guidance on dynamic headcount planning recommends starting from the revenue number, defining the major ratios, then building ramp time directly into the hiring calendar. If a new AE needs four months to reach full productivity, and you need that capacity live by Q3, the requisition needs to open in Q1, not Q2.
Backfill hires deserve their own line. If your support team has a certain attrition rate, a team of a given size needs replacement hires accordingly just to maintain headcount, before any growth-driven additions.
Pro Tip: Check revenue per employee against your own historical trend, not an industry average. A drop suggests the model may be adding heads faster than output is scaling, which is exactly the conversation finance needs to have before the budget gets approved, not after.
How Do You Build Base, Upside, and Downside Scenarios?
Scenario modeling turns a static plan into a decision tool. The mechanics are simple once the base model exists.
- Add a Scenario_ID cell and use a lookup or CHOOSE formula to pull the right assumption set (hiring pace, attrition, revenue growth) for each scenario into the Monthly Summary tab.
- Vary a small number of high-leverage inputs, not everything. Hiring pace, time-to-fill, attrition rate, and revenue growth rate typically account for most of the variance in payroll outcomes.
- Compare outputs across scenarios, not just inputs: payroll run rate, net new hires, and cumulative cash impact by quarter.
- Build one summary table that shows all three scenarios side by side so leadership can see the spread in a single glance instead of toggling between tabs.
What leadership does with a downside scenario is the real payoff. A downside case might trigger a hiring freeze on non-revenue roles. An upside case might justify accelerating two requisitions that were previously queued for Q3. A model without scenarios forces every one of these decisions to happen ad hoc, usually under pressure, usually too late.
- Base case: current trajectory, planned hiring pace holds
- Upside: revenue growth beats plan, hiring accelerates in revenue-generating roles
- Downside: revenue misses, non-critical hires freeze, backfills get reviewed case by case
How Payroll Timing Flows Into the P&L and Cash Forecast
Payroll expense and payroll cash rarely land in the same month. Salary expense gets recognized when earned, but the cash payment date depends on your pay cycle, and bonus or commission accruals often pay out months after they were earned. A model that ignores this gap will show a P&L that looks fine while cash quietly tightens.
Where this trips people up most often:
- Not prorating partial-month hires, which overstates near-term expense
- Excluding payroll tax and benefits burden from the cost figure used in cash planning
- Ignoring the lag between offer acceptance and start date, which shifts real cash impact later than the budget assumed
- Treating equity compensation as a cash cost when it should flow through as a non-cash P&L item with separate dilution tracking
Pro Tip: Run a quick sensitivity check: push one planned hire's start date back three months and watch what happens to quarterly cash. A single senior hire delayed a quarter can free up $30,000 to $50,000 in near-term cash, which matters enormously if you are watching a covenant or a runway number.
Who Owns the Model, and How Often Should It Be Reviewed?
Headcount planning fails as a discipline when it lives in one person's laptop and gets rebuilt from scratch every budget cycle. The fix is a defined cadence with clear ownership.
A monthly rolling forecast paired with a quarterly formal budget review covers most organizations well. Finance owns the model itself and signs off on cost assumptions. An HR data steward keeps the roster and role data accurate. Hiring managers submit driver updates on a fixed schedule, not whenever they remember to.
Artifacts worth keeping in every cycle:
- An assumptions log documenting what changed and why
- A scenario log showing which case was active when a decision got made
- A variance report comparing planned versus actual headcount and cost
- A reconciliation against your HRIS and payroll system, run monthly
Before any leadership review, run the consistency checks: does revenue per employee still make sense, does the department ratio match benchmark, and can every headcount swing be explained in one sentence. If it cannot, the model needs another pass before the meeting, not during it.
What Does a Working Excel File Actually Look Like?
The wiring is straightforward once you see it laid out: inputs flow from Assumptions into Current Roster and Planned Hires, those two feed the Monthly Summary through the fully-loaded cost and roll-forward formulas, and the Scenarios tab sits alongside all of it, swapping which assumption set feeds the summary.
- Build Assumptions first, with every rate in its own named cell, never buried in a formula.
- Build Current Roster and Planned Hires with matching column structures so they can be stacked or filtered together.
- Build the Monthly Summary last, referencing the roster tabs and pulling burden rates from Assumptions by name, not by cell reference.
Scalability comes down to three habits: use named ranges instead of raw cell references, never hard-code a rate anywhere outside the Assumptions tab, and lock that tab from casual edits once it is reviewed. Free starting templates from PivotXL and Workday are worth downloading for structure, but expect to rebuild the formulas around your own burden rates and ratios rather than trusting the defaults.
Where Fractional CFO Support Fits Into Headcount Modeling
Most headcount models break down in the same place: nobody validates the burden rate against actual payroll runs, so the fully-loaded cost figure drifts from reality within two quarters. A fractional CFO typically checks that number against your actual payroll tax filings and benefits invoices, then enforces the monthly cadence so the model doesn't sit stale until the next budget fire drill.
Common engagement tasks look like this:
- An assumptions workshop with finance, HR, and department leads to pressure-test every rate in the model
- Building or customizing the template itself, including the roll-forward and scenario logic
- Ongoing monthly maintenance and variance reporting against actuals
A reasonable starting point for most companies: an assumptions audit paired with a one-page wiring diagram workshop, enough to expose where the current model's numbers stop matching payroll reality.
The Part of Headcount Planning Everyone Underrates
Most advice on headcount planning obsesses over the model's structure, tabs, formulas, scenario toggles, and skips the harder problem: nobody owns keeping it honest. A model with perfect formulas and stale assumptions produces confident-looking garbage. I'd argue the assumptions log matters more than the formula logic itself, because formulas rarely break; burden rates, ramp times, and driver ratios quietly go out of date every quarter, and nobody notices until the variance report is ugly.
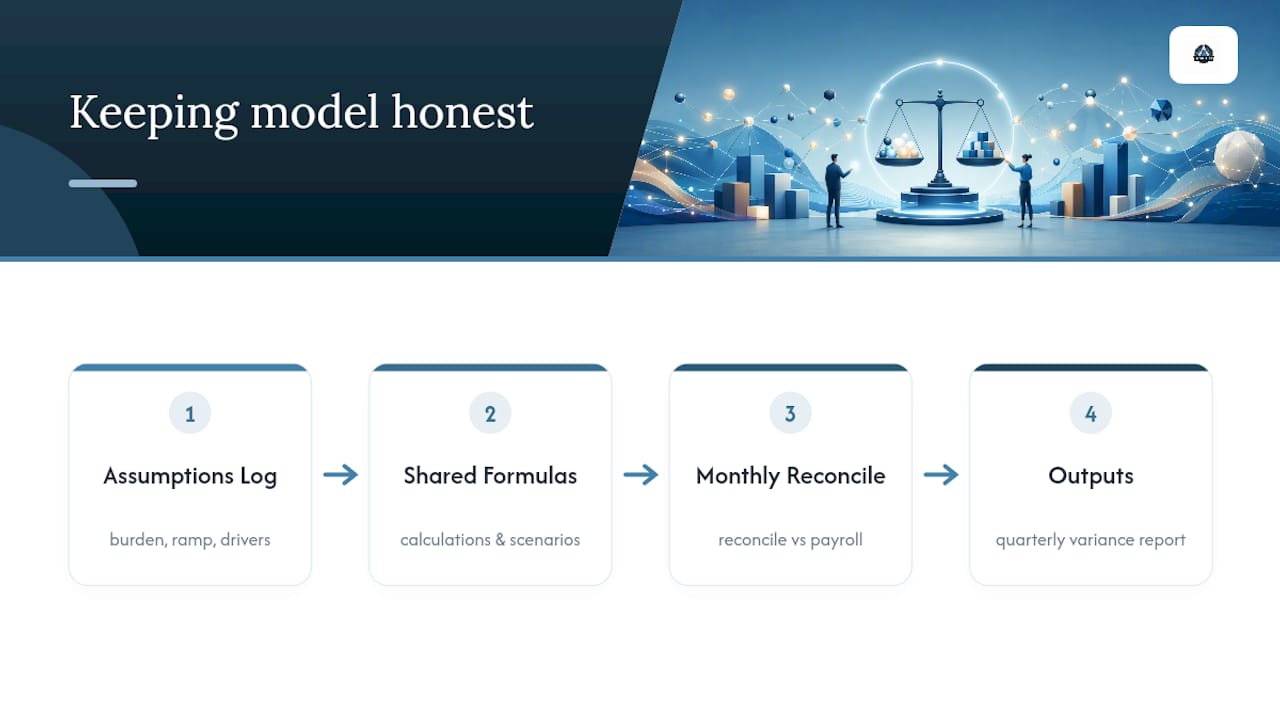
The other place conventional advice falls short is treating scenario planning as a leadership presentation exercise rather than a decision trigger. A downside scenario that doesn't specify which requisitions freeze first is just a spreadsheet exercise. Build the trigger into the model itself, tie specific roles to specific scenario thresholds, so the conversation happens before the crisis, not during it.
If you build only one habit from this article, make it the monthly reconciliation against actual payroll. Everything else, the driver ratios, the scenario logic, the scalability rules, matters less if that single check never happens.
— Angelica
Get Help Building a Model Finance Will Actually Trust
Fractional CFO consulting offers the same driver-based modeling discipline outlined above, without hiring a full-time FP&A lead to build and maintain it. A typical engagement starts with a quick assessment of your current headcount data and payroll setup, moves into an assumptions workshop to pressure-test your burden rates and driver ratios, then builds or customizes the model itself before shifting to an ongoing retainer for monthly maintenance and variance reporting.

This works particularly well if your bookkeeping and payroll data are not yet clean enough to trust the fully-loaded cost figures the model needs. Amcfo's accounting and bookkeeping support can get that foundation solid first, so the headcount numbers reconcile to real payroll runs instead of estimates. If you're ready to get a model built and maintained by someone who has done this across multiple industries, start with a look at Amcfo's fractional CFO services and request an initial assessment.
Sources
- How to Do Headcount Planning - Practical FP&A Guide (Step-by-step) - FMU University
- Creating a dynamic headcount plan — Greenhouse blog
FAQ
What Is Headcount Planning?
Headcount planning is the process of forecasting how many employees an organization needs, in which roles, and when, tied to fully-loaded cost and business drivers like revenue or ticket volume.
What Are the 5 R's of Workforce Planning?
Definitions vary across organizations, so there's no single agreed-upon list; most versions cover right people, right role, right time, right cost, and right place, framing workforce decisions around matching capacity to demand.
What Is the Formula for Calculating Headcount?
The core roll-forward formula is ending headcount equals beginning headcount plus hires minus attrition, while fully-loaded cost equals base salary multiplied by one plus payroll tax percentage plus benefits percentage, plus bonus and per-hire overhead, as detailed in FMU University's FP&A guide.
What Are the Different Models of Manpower Planning?
The main approaches are top-down (ratio-driven), bottom-up (department requests), hybrid or driver-based (operational ratios drive role counts), and scenario-based (base, upside, downside cases), with additional variants like skills-based and succession planning covered in Workday's workforce planning models overview.
Can a Fractional CFO Help Build a Headcount Planning Model?
Yes. A fractional CFO engagement, like those offered through Amcfo, typically includes an assumptions workshop, model build or customization, and ongoing monthly variance reporting to keep the model tied to actual payroll data.