

A rolling forecast is a financial planning model that continuously extends its forward horizon by dropping the oldest completed period and adding a new future period, keeping the forecast window constant at all times. Unlike a static annual budget locked in January, a rolling forecast actualizes each month: replace the just-closed period with real results, then push the horizon one period forward.
The most common setup uses a full-year rolling window. In a 3+9 configuration, actual periods are combined with projected data to complete that rolling view. Every month, the oldest forecast month becomes an actual, and a fresh month 12 is added at the far end.
Use a rolling forecast when your business needs cash visibility, frequent hiring or inventory decisions, or when the annual budget feels stale by March. FP&A teams, fast-growing companies, and cash-sensitive operations get the most out of it. Amcfo builds driver-based rolling models for businesses that need this kind of continuous planning support.
Table of Contents
- How a rolling forecast actually works
- Rolling forecasts vs. static budgets: how they differ and when to prefer each
- Benefits of rolling forecasts for FP&A and operational leaders
- Drawbacks and common implementation challenges
- How to create a rolling forecast: a step-by-step practical process
- Governance and best practices for reliable rolling forecasts
- Spreadsheets vs. FP&A platforms: which tooling fits your stage
- When (and when not) to adopt rolling forecasts: a decision checklist
- Amcfo's implementation checklist and sample 3+9 template
- Key Takeaways
- The part most finance guides skip
- A practitioner's perspective on rolling forecasts
- Amcfo helps you build and run rolling forecasts from day one
- Useful sources and further reading
How a rolling forecast actually works
The core mechanic is straightforward. Each period close triggers two actions: the just-finished month moves from "forecast" to "actual," and a brand-new month is appended at the far end of the window. The horizon never shrinks.

Actualizing is the term practitioners use for this replacement step. You are not revising history; you are anchoring the model in real results and letting those actuals drive the next projection cycle. A well-built model recalculates downstream months automatically when actuals land.
Common horizon lengths vary to suit business needs, balancing the planning look-ahead with uncertainty and assumptions required for longer periods.
The 3+9 format is a popular convention where several months of closed actuals anchor the model, and projections cover the remaining forecast window. Each month, the ratio shifts by one: after April closes, the model becomes 4+8, then 5+7, and so on, until the calendar year ends and the counter resets.

A simple month-by-month sequence looks like this: In January, the model shows Jan–Mar as actuals and Apr–Dec as forecast. After March closes, the model shows Jan–Mar actuals, Apr–Dec forecast, and a new January of the following year is added as month 12. The window always covers the next 12 months from today.
Rolling forecasts vs. static budgets: how they differ and when to prefer each
The annual budget is a governance document. The rolling forecast is an operational decision tool. Treating them as substitutes causes confusion; understanding what each does well makes the choice obvious.
| Dimension | Static annual budget | Rolling forecast |
|---|---|---|
| Update frequency | Once per year | Monthly or quarterly |
| Time horizon | Fixed (Jan–Dec) | Constant forward window (e.g., always 12 months ahead) |
| Basis of assumptions | Point-in-time, often top-down | Driver-based, updated with actuals |
| Flexibility | Low; variances accumulate without correction | High; model adjusts as conditions change |
| Best use case | Governance, targets, external reporting | Operational decisions, cash planning, scenario analysis |
Rolling forecasts are forward-looking decision tools; annual budgets remain important for governance, investor reporting, and setting performance targets. Most organizations benefit from running both. A retailer entering a volatile holiday season, for example, needs the rolling model to adjust inventory buys weekly, while the annual budget anchors the board's margin expectations.
Run them in parallel when you are transitioning. Many organizations run rolling forecasts alongside annual budgets for one full cycle before making the rolling model the primary planning tool. That parallel period lets teams learn the driver model without disrupting governance.
Benefits of rolling forecasts for FP&A and operational leaders
The practical payoff shows up in four areas:
- Business agility. Monthly or quarterly updates based on real-time drivers let management react to market shifts before they become crises. A SaaS company that sees churn spike in month two can revise its hiring plan in month three, not at next year's budget cycle.
- Improved accuracy over time. Because the model is updated with actuals every period, forecast error compounds less. Driver-based assumptions get tested and refined continuously rather than sitting unchallenged for 11 months.
- Better cash and resource planning. A rolling model gives treasury a 12-month cash runway view at all times. That visibility supports hiring decisions, capital expenditure timing, and inventory buys with far more confidence than a static budget that is already six months old. For more on managing that cash window, see Amcfo's guidance on cash flow best practices.
- Cross-functional alignment and scenario readiness. When operations, sales, and finance all update the same driver model, conversations shift from "whose number is right" to "what changed and why." Scenario analysis becomes a natural extension: adjust one driver (say, average deal size) and watch the revenue and headcount implications ripple through automatically. For a deeper look at building those scenarios, the scenario planning guide from Aidventure covers the mechanics well.
Drawbacks and common implementation challenges
Rolling forecasts are not frictionless. The technical build is usually the easy part.
The cultural shift is harder. Getting operations teams to own their drivers, and to treat a forecast miss as a learning signal rather than a performance failure, takes deliberate change management. Finance teams that skip this step often end up maintaining the rolling model alone, which defeats the purpose.
Data quality is the other common failure point. A rolling model fed by inconsistent actuals or manual spreadsheet pulls will drift from reality quickly. Spreadsheets also become fragile at scale: version conflicts, broken formulas, and manual-entry errors are routine once the model grows beyond a handful of drivers.
Practical mitigations:
- Limit the model to 3–7 high-impact drivers rather than forecasting every ledger line. Driver-based rolling models that focus on a small set of key metrics explain most variance and stay manageable.
- Automate data pulls from your ERP, CRM, or accounting system wherever possible. Manual data entry is where rolling forecasts break.
- Run in parallel with the annual budget for at least one full cycle before switching.
- Phase the rollout: start with one business unit or one P&L section, prove the model, then expand.
For small and mid-size businesses, the honest trade-off is time versus insight. A basic rolling model in Excel takes a few hours per month to maintain; a purpose-built FP&A platform costs more upfront but pays back in reduced reconciliation time as complexity grows.
How to create a rolling forecast: a step-by-step practical process
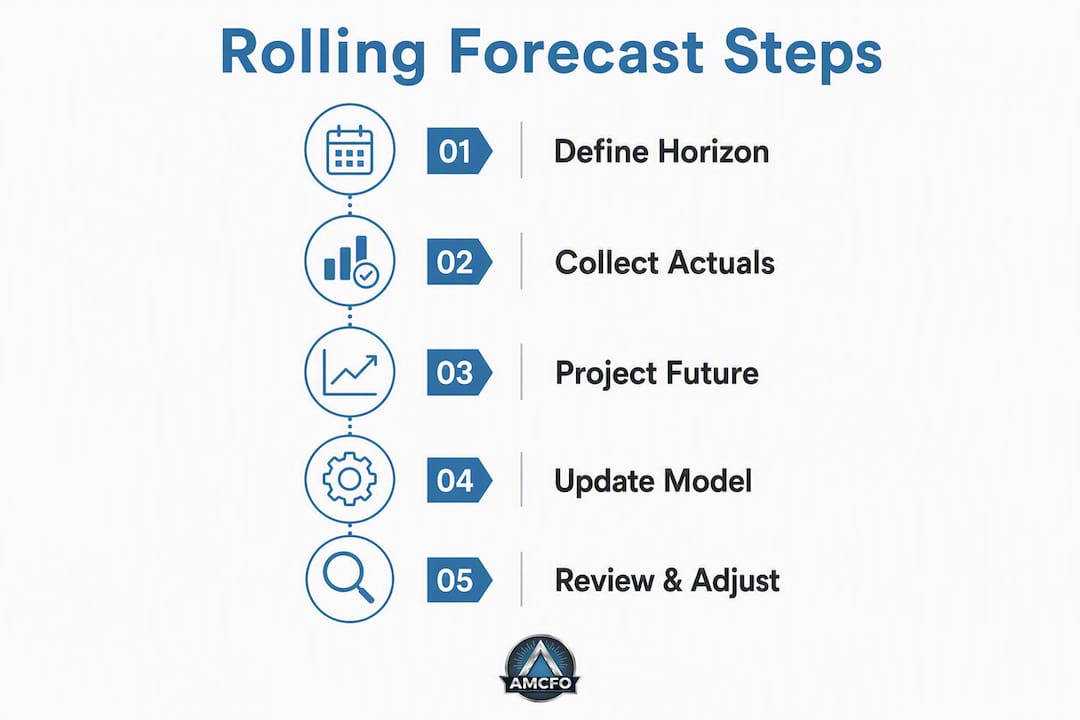
A six-step approach covers the full build from objective-setting to live review cycles. Here is how to work through it:
- Define what decisions the forecast must support. Hiring? Inventory? Capital spend? The answer shapes everything else. A forecast built to support monthly hiring decisions needs different drivers than one built to manage a construction project pipeline.
- Set your horizon and cadence. A rolling window with frequent updates fits most businesses. Match cadence to how quickly your drivers change: fast-moving businesses update monthly; more stable operations may update quarterly.
- Identify key drivers. Map each driver to a financial line item. For a services business: billable headcount drives revenue; utilization rate drives gross margin; headcount growth drives payroll expense. Keep it tight.
- Build or connect your data feeds. Pull actuals from QuickBooks, your ERP, or your CRM automatically where possible. Sketch a reconciliation step to catch discrepancies before they propagate.
- Run in parallel for one cycle. Maintain the annual budget and the rolling model simultaneously for one quarter or one full cycle. Use that period to test driver assumptions and build stakeholder confidence.
- Review, validate, and hand off ownership. After the parallel run, assign driver ownership to the relevant department heads. Finance facilitates; operations owns the inputs.
Implementation checklist:
- Objectives documented and signed off by leadership
- Horizon and cadence agreed (12 months, monthly update)
- 3–7 drivers identified and mapped to financial lines
- Data sources confirmed and pull method defined (automated preferred)
- Parallel run scheduled (minimum one quarter)
- Driver owners assigned by department
- First review meeting on the calendar
Pro Tip: Build the 3+9 template in a single tab with a "current month" toggle. When you flip the toggle to the new month, the model automatically reclassifies the oldest forecast month as an actual row and appends a new month 12. This eliminates the most common manual-entry error in rolling forecast maintenance.
For a broader look at building a forecasting process from scratch, Amcfo's guide on financial forecasting for SMBs covers the foundational steps in detail.
Governance and best practices for reliable rolling forecasts
A rolling forecast without governance becomes a spreadsheet that nobody trusts. The practices below keep it credible.
Assign ownership clearly. Each driver needs one named owner who updates it each period. Finance consolidates; it does not originate every input. When sales owns the pipeline conversion rate and operations owns headcount, the model reflects real operational knowledge rather than finance's best guess.
Define the review cadence and agenda. A monthly 60-minute review meeting should cover: actuals vs. prior forecast (variance analysis), driver assumption changes and their rationale, and the updated 12-month outlook. Leadership should see a one-page summary: revenue, gross margin, cash, and headcount, with a brief narrative on what changed and why.
Maintain an assumptions log. Every time a driver assumption changes, document the old value, the new value, and the reason. This log is your audit trail and your learning record. After six months, patterns emerge: which drivers you consistently over- or under-estimate, and why.
Set accuracy KPIs. Targets for forecast-to-actual variance help maintain model reliability and focus improvement efforts. Track this monthly. When a driver consistently misses, revisit its definition before blaming the data.
Run a brief post-mortem after each quarter: what drove the largest variances, and does the driver definition need to change? This habit is what separates a rolling forecast that improves over time from one that stagnates.
Spreadsheets vs. FP&A platforms: which tooling fits your stage
The right tool depends on your team size, data complexity, and how often assumptions change.
Excel or Google Sheets works when:
- The model remains limited to a small number of drivers and business units
- Actuals can be pulled cleanly from a single source (QuickBooks, for example)
- The team has one dedicated person to maintain it monthly
- Budget for a dedicated platform is not available
Move to a dedicated FP&A platform when:
- Driver-based models break down in static spreadsheets at scale due to version conflicts, broken links, and manual-entry errors
- Multiple contributors need to update drivers simultaneously
- You need scenario versioning, audit trails, or integration with multiple data sources
- The monthly reconciliation effort exceeds four to six hours
Migration checklist for moving off spreadsheets:
- Document all current drivers and their data sources before migrating
- Validate that the platform can connect to your ERP or accounting system directly
- Run the platform and the spreadsheet in parallel for one cycle to confirm output parity
- Train driver owners on the new input interface before go-live
For SMBs, the cost-benefit math is straightforward: if manual reconciliation and error-checking consume more than a day per month, a platform pays for itself quickly. If the model is simple and stable, Excel is fine. The goal is a model people actually use, not the most sophisticated tool available.
When (and when not) to adopt rolling forecasts: a decision checklist
Use this checklist to decide whether a rolling forecast will help your organization now.
Signals that favor adoption:
- Your market or revenue mix changes faster than once per year
- You make hiring, inventory, or capital decisions more than quarterly
- Your annual budget is materially wrong within 90 days of being set
- Cash visibility beyond 60 days is a recurring concern
- Leadership asks "what does the rest of the year look like?" more than once per quarter
- You have at least one person who can own the model monthly
When to wait or skip:
Highly regulated businesses with statutory budget requirements, or organizations where revenue and costs are genuinely fixed for 12 months (certain government contractors, for example), gain little from a rolling model. The overhead of monthly updates is not justified when nothing material changes between cycles. Similarly, if your actuals data is unreliable or arrives weeks late, fix the data pipeline first. A rolling forecast built on bad actuals is worse than no forecast at all.
Threshold rule: if you answered "yes" to four or more of the six checklist items above, a rolling forecast will likely pay for itself within two quarters.
Amcfo's implementation checklist and sample 3+9 template
The table below shows a sample 3+9 rolling forecast structure for a business on a calendar-year cycle, updated after March closes.
| Period | Status | Revenue | Gross Margin | Headcount |
|---|---|---|---|---|
| January | Actual | — | — | — |
| February | Actual | — | — | — |
| March | Actual | — | — | — |
| April | Forecast | — | — | — |
| May | Forecast | — | — | — |
| June | Forecast | — | — | — |
| July | Forecast | — | — | — |
| August | Forecast | — | 60% | — |
| September | Forecast | — | 60% | — |
| October | Forecast | — | 60% | — |
| November | Forecast | — | — | — |
| December | Forecast | — | — | — |
After April closes, January drops off the visible window, April becomes an actual, and a new January (next year) is appended as month 12. The 3+9 ratio becomes 4+8 until the next close.
Amcfo implementation checklist:
- Week 1–2: Define objectives and identify 3–7 drivers with department heads. Owner: CFO or fractional CFO.
- Week 3–4: Build or configure the model (Excel or platform). Map drivers to financial lines. Owner: Finance lead.
- Month 2: Load historical actuals (minimum 12 months). Run first forecast cycle. Owner: Finance lead with department input.
- Month 3: Begin parallel run alongside annual budget. Hold first review meeting. Owner: CFO, department heads.
- Month 4–6: Refine driver assumptions based on variance analysis. Document changes in assumptions log. Owner: Finance lead.
- Month 6+: Full rollout. Rolling forecast becomes primary operational planning tool. Annual budget retained for governance.
Realistic effort for an SMB: expect 20–40 hours to build the initial model, 4–8 hours per month to maintain it, and 2–4 hours per month for the review cycle. A fractional CFO engagement through Amcfo can compress the build phase significantly, particularly for driver mapping and data integration. Learn more about Amcfo's financial planning and management services or review the full service and accounting packages to find the right level of support.
Key Takeaways
A rolling forecast keeps your planning horizon constant by replacing closed actuals and extending the window forward, giving FP&A teams a live, driver-based view of the next 12 months rather than a budget that ages on the shelf.
| Point | Details |
|---|---|
| Core mechanic | Drop the oldest period, add a new future period; the 12-month window never shrinks. |
| 3+9 convention | Three months of actuals plus nine months of forecast; ratio shifts by one each month as actuals land. |
| When to adopt | Use when decisions happen more than quarterly, cash visibility matters, or the annual budget is stale within 90 days. |
| Governance matters | Assign driver ownership to department heads; track forecast-to-actual variance monthly with a documented assumptions log. |
| Amcfo support | Amcfo's fractional CFO services cover driver mapping, model build, and ongoing forecast governance for businesses of all sizes. |
The part most finance guides skip
A practitioner's perspective on rolling forecasts
The technical build of a rolling forecast is rarely where organizations struggle. A 3+9 model in Excel can be functional in a week. What takes months, sometimes longer, is convincing the operations team that their driver inputs are not a performance trap.
The fear is understandable. If a sales leader submits a pipeline conversion rate and the model misses, they worry they will own that miss. The fix is not better training on the model mechanics. It is reframing variance analysis as a diagnostic, not a scorecard. When a driver misses, the first question should be "what changed in the business?" not "who got it wrong?" Organizations that make that cultural shift see their forecast accuracy improve steadily, because driver owners start giving honest inputs instead of sandbagged ones.
The other thing worth saying plainly: a rolling forecast is not a replacement for judgment. It is a structure that makes judgment faster and better-informed. The businesses that get the most out of rolling forecasts are the ones where leadership actually reads the monthly variance narrative and asks follow-up questions. When the forecast becomes a document that finance produces and nobody else reads, it has already failed, regardless of how elegant the model is.
Treat it as a management tool that happens to live in a spreadsheet or a platform. The meeting cadence, the assumptions log, the driver ownership, those are the forecast. The numbers are just the output.
Amcfo helps you build and run rolling forecasts from day one
Building a rolling forecast is straightforward when you have the right structure in place. Getting the driver mapping right, connecting it to your actual accounting data, and running the first review cycle with leadership, that is where most businesses stall without experienced support.
Amcfo's fractional CFO services cover the full implementation: defining your 3–7 key drivers, building or configuring the model, integrating it with QuickBooks or your existing accounting system, and facilitating the first governance cycle with your team. There is no long-term lock-in. Most clients start with a pilot engagement covering one quarter, validate the model, and then decide how much ongoing support they need.
If your annual budget is already feeling stale and you want a live 12-month view of your business, the next step is a discovery call with the Amcfo team. Visit amcfo.com to get started.
Useful sources and further reading
- What Is a Rolling Forecast? Pros, Cons, and Best Practices (NetSuite) — Solid overview of rolling forecast mechanics, benefits, and governance considerations for finance teams.
- What Is a Rolling Forecast? (IBM) — Clear definition of actualizing and the operational logic behind rolling windows; good for sharing with non-finance stakeholders.
- Rolling Forecasts: The Complete FP&A Guide With Examples (Farseer) — Detailed practitioner guide covering driver selection, the 3+9 convention, and common pitfalls.
- How To Build a Rolling Forecast in 6 Steps (Vena) — Step-by-step process guide with practical guidance on cadence, tooling, and phased rollouts.
- Rolling Forecast (Workday) — Concise explanation of how rolling forecasts support agility and driver-based planning in FP&A contexts.
- Business Forecasting Methods for Financial Leaders (Amcfo) — Amcfo's overview of forecasting techniques and when to apply each method, written for finance leaders managing multiple planning tools.