

A cash flow projection is a spreadsheet forecast of the money moving in and out of your business over a set period, and its whole job is to answer one question: will you have enough cash on hand to cover what you owe? Profit doesn't answer that question. Timing does.
The entire model runs on one formula: Ending cash = Opening cash + Total inflows − Total outflows. Run that math for each week or month, and each period's ending balance becomes the next period's opening balance.
You can start this hour with three numbers:
- Your current bank balance (opening cash).
- What you realistically expect to collect this month or week (inflows).
- What you're committed to paying out in that same window (outflows).
Everything past this point is refinement.
Key Takeaways
A cash flow projection works only when it tracks actual payment timing rather than invoice terms, and stays useful only if someone updates it regularly.
| Point | Details |
|---|---|
| Master the core formula | Ending cash equals opening cash plus total inflows minus total outflows, carried forward each period. |
| Use real collection behavior | Model AR based on historical cohort collection rates, not stated payment terms. |
| Match cadence to purpose | Use weekly, direct-method forecasts for operational liquidity and monthly for broader planning. |
| Stress test before you trust it | Run 10% to 30% slower collection scenarios to see the real impact on runway. |
| Bring in Amcfo when stakes rise | Amcfo's fractional CFO services set up the model, run variance reviews, and keep the forecast current. |
Table of Contents
- Data and Documents to Gather Before You Open a Spreadsheet
- Step-by-Step: Build a 12-Month Cash Flow Projection in a Spreadsheet
- Choosing the Right Timeframe and Granularity
- How to Test Assumptions and Validate the Model
- Practical Excel Tips, Formula Snippets, and Where to Get a Template
- If the Projection Shows a Shortfall: What to Do First
- When to Outsource Cash Flow Forecasting and How a Fractional CFO Helps
- Handling Non-Cash Items Versus Actual Cash Flows
- Incorporating Seasonality and Business Cycles Into Projections
- Techniques for Dealing With Uncertain or Irregular Cash Flows
- Tying the Projection Into Your Broader Financial Plan
- What Changes When Owners Actually Watch Their Cash Weekly
- Get Your Cash Flow Model Built and Reviewed by a Fractional CFO
- Sources
Data and Documents to Gather Before You Open a Spreadsheet
Grab these before you touch a spreadsheet. Working from memory or a gut feel is the single fastest way to build a projection you'll abandon in three weeks.
- Current bank balances across every operating account, consolidated into one starting cash figure.
- Accounts receivable aging report, broken out by how old each invoice is.
- Accounts payable schedule, showing what you owe and when it's due.
- Payroll calendar, including gross wages, tax deposits, and benefit payments.
- Recent profit and loss statement and cash flow statement, ideally the last three to twelve months.
- Recurring subscriptions and fixed costs (software, rent, insurance, loan payments).
- Known one-off outlays, like equipment purchases, loan principal payments, or tax installments.
Pull at least three months of transaction history if you're new to forecasting, and twelve months if your business has any seasonal swing. Note your actual payment terms versus what customers actually do, and flag any timing quirks: a big client who always pays 45 days late, a slow month every January, a supplier who demands payment on delivery. If you run multiple bank accounts, add them together into one starting cash number rather than tracking them separately. A common accounting challenge for small businesses is treating each account in isolation, which hides the real cash position.
Step-by-Step: Build a 12-Month Cash Flow Projection in a Spreadsheet
Open a blank spreadsheet and set it up with periods running across the top and cash categories running down the side. This is the format Wells Fargo's small business guidance recommends, and it's the layout every accountant defaults to for good reason: it's easy to audit and easy to extend.
1. Set your columns. Each column is one reporting period. Twelve months across the top works for annual planning. If you need tighter operational visibility, use weekly columns instead, covered in the next section.
2. Set your rows. From top to bottom:
- Opening cash balance
- Inflows by category (cash sales, AR collections, financing, other income)
- Total inflows
- Outflows by category (payroll, rent, suppliers, taxes, loan payments, capital expenditures)
- Total outflows
- Net cash flow (total inflows minus total outflows)
- Ending cash balance
3. Build the carry-forward formula. This is the mechanic that makes the whole model work. In your spreadsheet, January's ending balance becomes February's opening balance. If January's opening cash sits in cell B2 and net cash flow for the month is in B7, your ending balance formula in B8 is simply =B2+B7. Then February's opening balance cell just references =B8. Chain that across all twelve columns and the sheet updates itself every time you change an assumption upstream.
4. Use functions that do the heavy lifting. SUM totals each category column. SUMIFS pulls totals by category and date range straight from a raw transaction export, so you're not retyping numbers by hand. XLOOKUP (or INDEX/MATCH if your version of Excel doesn't support it) pulls a specific customer's expected payment date from your AR aging tab into your projection tab without copy-pasting. Wrap anything prone to errors in IFERROR so a missing reference shows a zero instead of breaking the whole sheet.
Here's what one sample month looks like with hypothetical numbers:
Notice April's ending balance drops even though inflows are close to March's. That's the entire point of running this exercise: a single slow month becomes visible weeks before it happens rather than showing up as a surprise overdraft alert.
For the inflow side, separate cash sales from AR collections from financing proceeds. They behave completely differently, and lumping them together hides which lever is actually driving your cash position. On outflows, break out payroll, rent, supplier payments, tax obligations, and capital expenditures separately. Investopedia's breakdown of cash flow planning groups these into operating, investing, and financing activities, and that structure helps you spot which category is straining your balance.
Pro Tip: Add conditional formatting that turns the ending cash row red any time the value drops below your minimum comfortable balance, not just below zero. A near miss deserves your attention just as much as an actual shortfall.
Choosing the Right Timeframe and Granularity
Match your reporting cadence to the decision you're trying to make. A 13-week rolling forecast, updated weekly against actual bank activity, is the right tool for operational liquidity questions: can you make payroll, can you pay this vendor on time. Treasury forecasting guidance recommends the direct method for this window, meaning you project actual cash receipts and disbursements line by line rather than working backward from projected earnings.
A monthly projection spanning three to twelve months serves a different purpose: budget planning, hiring decisions, loan applications. Beyond twelve months, most businesses shift to the indirect, top-down method, starting from projected net income and adjusting for non-cash items rather than forecasting every transaction.
Don't mix the two methods inside the same forecast window. A direct versus indirect approach comparison makes the case clearly: blending them within one horizon creates reconciliation headaches that undermine confidence in the whole model. Pick one method per horizon and stay consistent.
How to Test Assumptions and Validate the Model
A projection is only as good as its weakest assumption, and the weakest assumption is almost always AR timing. Model receivables using actual collection cohorts rather than invoice terms. If your historical data shows a large portion of invoices actually get paid in the month following billing rather than the full amount your 30-day terms promise, use that portion as your inflow assumption. Cohort-based collection modeling consistently outperforms invoice-terms modeling because customer behavior, not your payment policy, drives when cash actually lands.
Once the base case is built, stress test it:
- Slow AR collections by 10% to 30% and see how many weeks of runway that costs you.
- Delay your single largest customer's payment by two weeks and check the impact.
- Push a major expense forward or back a month and watch how the ending balance shifts.
Reconcile your projected opening and closing balances against your actual bank statements every review cycle. A rolling forecast that isn't checked against real bank activity degrades fast, often losing meaningful accuracy within one or two cycles.
Pro Tip: Keep a simple variance log next to your model: projected versus actual for each period, with a one-line note on why they differed. After three or four cycles, that log tells you exactly which assumption to fix.
Practical Excel Tips, Formula Snippets, and Where to Get a Template
A few habits separate a spreadsheet that works from one that breaks the first time you touch it:
- Use named ranges for key inputs like your minimum cash threshold, so formulas read clearly and update everywhere at once.
- Wrap lookup formulas in IFERROR so a missing month doesn't throw a cascading error across the sheet.
- Apply conditional formatting to flag any ending balance below your comfort threshold and any month where outflows jump more than 20% from the trailing average.
- Set simple data validation on category dropdowns so every transaction gets tagged consistently, which makes your
SUMIFSformulas reliable.
A good template comes prebuilt with inflow and outflow categories, carry-forward logic already wired in, and a separate scenarios tab for stress testing. The Nonprofit Finance Fund's cash flow projection template includes both a monthly and shorter-term structure, and templates with built-in cohort collection rates and dedicated scenario sheets measurably speed up the stress-testing step and cut down on formula errors compared to building from a blank grid.
If the Projection Shows a Shortfall: What to Do First
Spotting a negative month weeks ahead is the entire value of doing this exercise. Here's the order of operations once your model flags one:
- This week: Accelerate collections on anything overdue, and pause any non-essential discretionary spending until the gap clears.
- Next two weeks: Draw on an existing credit line, explore invoice financing if you have strong AR, and call vendors on your largest upcoming payments to negotiate extended terms before the due date, not after.
- Within 30 to 60 days: Revisit hiring timing, delay any capital expenditure that isn't urgent, and trim inventory orders to free up cash tied up on shelves.
- 60 to 90 days out: Update the model with whatever you negotiated or arranged, and confirm the shortfall is actually resolved rather than just pushed a month later.
Every one of those moves should get entered back into the spreadsheet immediately. A contingency plan that lives in your head and not in the model doesn't help the next person who opens the file.
When to Outsource Cash Flow Forecasting and How a Fractional CFO Helps
Some situations call for bringing in outside expertise rather than building this alone:
- You're in an active cash crunch and need a defensible plan fast, not a learning curve.
- You want a 13-week rolling forecast set up and connected to your accounting system, not rebuilt from scratch every week.
- You're preparing for a raise, a loan application, or an expansion and need scenario modeling a lender or investor will trust.
A fractional CFO typically sets up the model, establishes a review cadence, runs the variance analysis each cycle, and hands you a short list of recommendations rather than just a spreadsheet. That governance piece is usually what's missing when owners build a model themselves: the sheet gets built once, then goes stale within a month. If the cost of a forecasting engagement is smaller than the cost of one missed payroll or one panicked short-term loan, that's usually your answer. Amcfo's fractional CFO services are built around exactly this kind of model setup and ongoing review.
Handling Non-Cash Items Versus Actual Cash Flows
Your P&L and your cash flow projection will never match line for line, and that's by design, not a mistake. Depreciation is the clearest example: it reduces net income on your income statement, but no cash actually leaves your account when you record it. Leave depreciation out of your projection entirely. It's an accounting entry, not a cash event.
Accrued expenses work the opposite way. If you've booked a cost on your P&L but haven't paid it yet, cash hasn't moved. Your projection should reflect the payment date, not the accrual date. The same logic applies to revenue: recognizing a sale on your books doesn't put money in your account. Only the actual customer payment does, and that's the date your projection cares about.
Loan proceeds and loan principal payments create the reverse confusion. Taking out a loan puts real cash in the bank, but it never touches your income statement as revenue. Principal repayments pull real cash out but don't show up as an expense on your P&L, only the interest portion does. If you're building your cash projection by starting from projected net income (the indirect method), you have to add back non-cash charges like depreciation and adjust for the full loan principal movement, or your ending cash figure will be wrong even though your net income looks fine.
Incorporating Seasonality and Business Cycles Into Projections
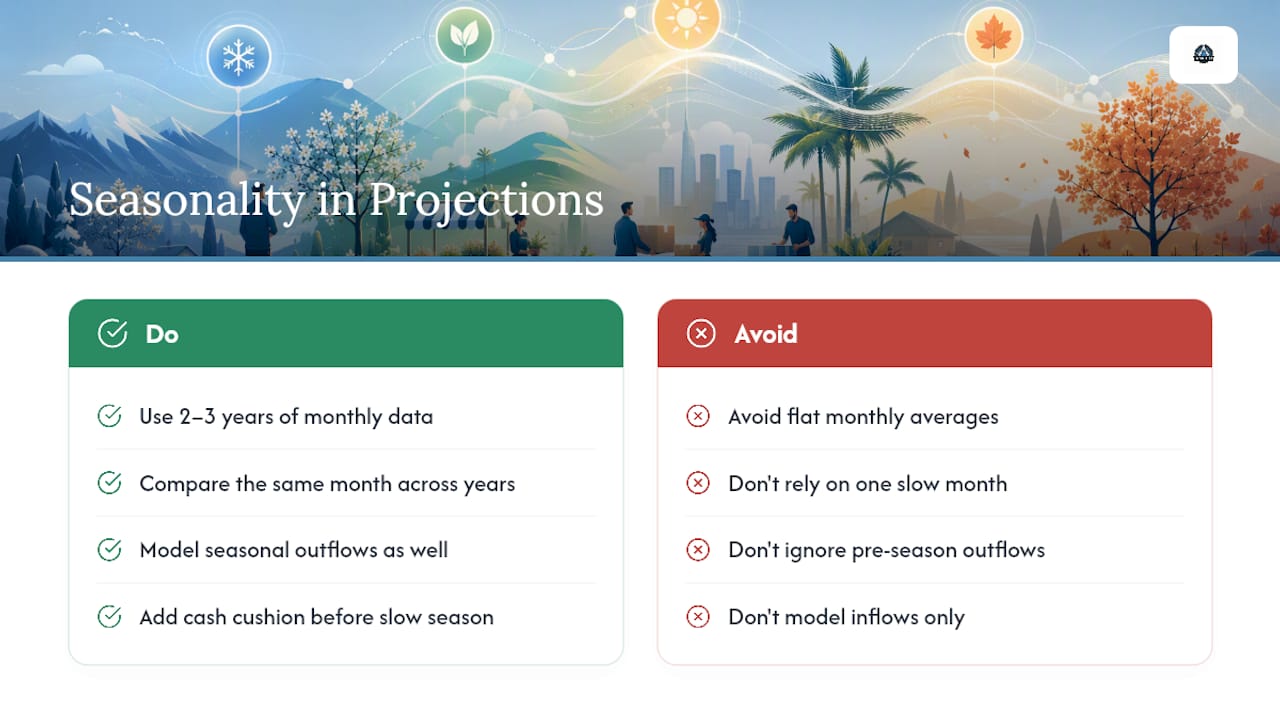
If your business has a busy season and a slow season, your projection needs to show that swing explicitly, not average it away. A landscaping company that does 70% of its annual revenue between April and September has a completely different cash profile in February than in June, and a flat monthly average across all twelve months hides that reality until it's too late to plan around it.
Pull at least two, ideally three, years of monthly historical data if your business has any cyclical pattern. Look at the same month across multiple years rather than just last month's trend. A single slow January might be an anomaly. Three slow Januarys in a row is a pattern you need to build into every future projection.
Build seasonality into your outflow assumptions too, not just inflows. Many businesses ramp up staffing, inventory, or marketing spend ahead of their busy season, which means outflows climb before the inflow surge arrives to cover them. That gap is exactly the kind of shortfall a projection is supposed to catch early. If you know your slow season runs November through January, build extra cash cushion into your October ending balance target rather than hoping the numbers work out. Retail, hospitality, agriculture, and construction businesses all face this pattern in different forms, and the fix is the same in every case: model the actual historical curve, not a flat average.
Techniques for Dealing With Uncertain or Irregular Cash Flows
Irregular revenue, project-based work, and lumpy customer payments make forecasting harder, but not impossible. The fix isn't more precision. It's building ranges instead of single numbers.

For inflows you genuinely can't predict with confidence, build three scenarios rather than one: a conservative case, a likely case, and an optimistic case. Run your ending cash calculation under all three and pay attention to what the conservative case tells you about your minimum runway. That's the number that should drive your contingency planning, not the optimistic one.
If you rely on a small number of large customers or contracts, model each one individually rather than lumping them into a general revenue line.
For genuinely unpredictable income, like a business that does a mix of retainer work and one-off projects, separate the predictable base (retainers, recurring contracts) from the irregular layer (project work, one-off sales) in your model. Forecast the base with confidence and treat the irregular layer as upside, not as guaranteed cash you can plan spending against. That separation alone prevents most of the overconfidence that sinks irregular-income businesses when a slow quarter hits.
Tying the Projection Into Your Broader Financial Plan
A cash flow projection that lives in isolation from your budget is only doing half its job. Your annual budget tells you what you plan to spend and earn; your projection tells you when that money actually moves. Run them side by side and check for gaps: if your budget assumes a marketing spend increase in March but your projection shows tight cash that month, one of the two plans needs to change before March arrives, not after.
Feed your projection back into decisions about hiring timing, loan structuring, and pricing. If your model consistently shows a cash dip every fourth quarter, that's useful information for negotiating loan covenants or timing a credit line renewal well ahead of when you'll actually need it. Financial modeling done well connects your day-to-day cash position to these bigger strategic calls instead of treating them as separate exercises.
Review your projection against your budget at the same cadence, whether monthly or quarterly, so variances get caught early rather than discovered at year-end when it's too late to adjust course.
What Changes When Owners Actually Watch Their Cash Weekly
The businesses that avoid a cash crisis aren't the ones with the biggest reserves. They're the ones who caught the dip six weeks out instead of six days out. A projection that flags a negative month in week three of a quarter gives you time to call a vendor, delay a purchase, or draw on a credit line calmly instead of scrambling.
The bigger shift is in what the numbers get used for. Once a projection runs weekly against real bank activity, hiring decisions stop being "can we afford this today" and start being "does this fit the next six months of cash." Capital purchases get timed against the slow season instead of whenever the equipment breaks. That's the real payoff: not a prettier spreadsheet, but decisions made with six weeks of lead time instead of zero.
Get Your Cash Flow Model Built and Reviewed by a Fractional CFO
Building the spreadsheet yourself gets you a working model. Getting it set up correctly the first time, with cohort-based collection rates, a scenarios tab, and a review cadence that actually holds, is where most owners run out of time or patience.

Amcfo starts every forecasting engagement with a quick diagnostic of your current bank data, AR aging, and payment history, then builds the model with your actual collection behavior baked in rather than generic invoice terms. A typical starter engagement includes model setup, a first round of scenario testing, and either a handoff with documentation or an ongoing retained review, whichever fits how hands-on you want to stay. That maps directly onto the steps in this guide: the inputs, the layout, the validation, and the contingency planning, done once by someone who builds these for a living. If you're weighing outsourced bookkeeping alongside forecasting, Amcfo's accounting and bookkeeping services cover both under one engagement. Reach out through Amcfo's fractional CFO page to get a starter model built around your actual numbers.
Sources
- Creating a cash flow projection
- Cash Flow Forecasting: A Comprehensive Guide
- Cash Flow Forecasting: Methods, Templates & Tips
This article is general information, not a substitute for advice from a qualified financial advisor. Consult a qualified financial professional about your own circumstances before acting on anything here.