

The cash conversion cycle (CCC) is the number of days a company needs to turn inventory and receivables into cash. The formula is CCC = DIO + DSO − DPO. Fewer days generally mean stronger working capital efficiency, though the right target depends heavily on your industry and business model.
TL;DR:
- Negative CCC in retail and restaurants often indicates efficient cash flow but can hide risks if driven by extended payables rather than operational speed.
- The main drivers of CCC are inventory levels, collection speed, and supplier payment terms, each influenced by operational and credit strategies.
- Improving DSO typically yields faster cash releases, with a one-week cut in receivables potentially freeing up hundreds of thousands of dollars for growth or debt reduction.
- Sector benchmarks vary widely, with manufacturing and construction usually having longer CCC, while retail and grocery often run negative, reflecting their distinct cash collection and payment cycles.
- Sequential, targeted efforts to optimize each component—starting with inventory planning or receivables collection—are more effective than simultaneous blanket changes.
Table of Contents
- What Does the Cash Conversion Cycle Actually Measure?
- How Do You Calculate CCC From Financial Statements?
- What Drives DIO, DSO, and DPO Up or Down?
- Why Does CCC Matter, and What Do Good Benchmarks Look Like?
- Tactical Playbook: How Do You Actually Shorten Your CCC?
- A Worked Example: Calculating CCC Step by Step
- How Amcfo Helps You Turn CCC Analysis Into Cash
- An Editorial Take on Fixing Your Cash Conversion Cycle
- Sources
What Does the Cash Conversion Cycle Actually Measure?
CCC tracks the gap between spending cash on inventory and getting that cash back from customers. It's the clock that runs from the moment you pay a supplier to the moment a customer's payment clears your bank account. That gap has to get funded somehow, either from your own cash reserves, a line of credit, or by squeezing suppliers on terms.
The formula pulls together three separate timing metrics:
- Days Inventory Outstanding (DIO): how long inventory sits before it sells
- Days Sales Outstanding (DSO): how long it takes customers to pay after a sale
- Days Payable Outstanding (DPO): how long you take to pay your own suppliers
CCC = DIO + DSO − DPO, and each component gets calculated from turnover ratios and average balance-sheet figures, then converted into days using a 365-day year.
CCC matters most for businesses that hold physical inventory: manufacturers, distributors, retailers, and restaurants. A software company or a consulting firm with no inventory and instant digital delivery doesn't need this metric nearly as much, since their DIO is often zero and their working capital story is really just about DSO. If you're carrying stock and extending credit to customers, though, CCC is one of the fastest ways to spot where cash is getting stuck.
One nuance worth flagging early: you can't pull CCC straight from a cash flow statement, because that statement mixes in financing and investing activity that has nothing to do with your operating cycle. CCC has to be derived from balance sheet averages to isolate the true operating timeline.
How Do You Calculate CCC From Financial Statements?
Calculating CCC by hand takes about ten minutes once you know where to look. Here's the sequence:
- Pull your average balances. For inventory, accounts receivable, and accounts payable, take (beginning balance + ending balance) ÷ 2. Use the start and end of the period you're measuring, whether that's a quarter or a full year.
- Calculate DIO. Divide average inventory by cost of goods sold (COGS), then multiply by 365. Formula: DIO = (Average Inventory ÷ COGS) × 365.
- Calculate DSO. Divide average accounts receivable by total revenue, then multiply by 365. Formula: DSO = (Average AR ÷ Revenue) × 365.
- Calculate DPO. Divide average accounts payable by COGS, then multiply by 365. Formula: DPO = (Average AP ÷ COGS) × 365.
- Combine them. CCC = DIO + DSO − DPO. That final number is your operating cycle in days.
A few pitfalls trip up even experienced finance teams. First, mixing timeframes: if you calculate DIO on an annual basis but DSO on a quarterly basis, your CCC is meaningless. Pick one period and convert consistently, using 90 days for a quarter if you go that route.
Second, using ending balances instead of averages. A company that just had a huge inventory dump right before quarter-end will show a distorted DIO if you skip the averaging step. Third, forgetting that DIO and DPO both use COGS, not revenue, while DSO uses revenue. Mixing those up is the single most common calculation error.
Finally, watch your accounting method. Businesses that recently moved from cash-basis to accrual accounting often see their receivables and payables balances shift meaningfully, which throws off period-over-period CCC comparisons if you're not careful about when the change happened.
What Drives DIO, DSO, and DPO Up or Down?
Each component of CCC responds to a different set of operational levers, and understanding which lever to pull first is what separates a useful CCC review from a spreadsheet exercise nobody acts on.
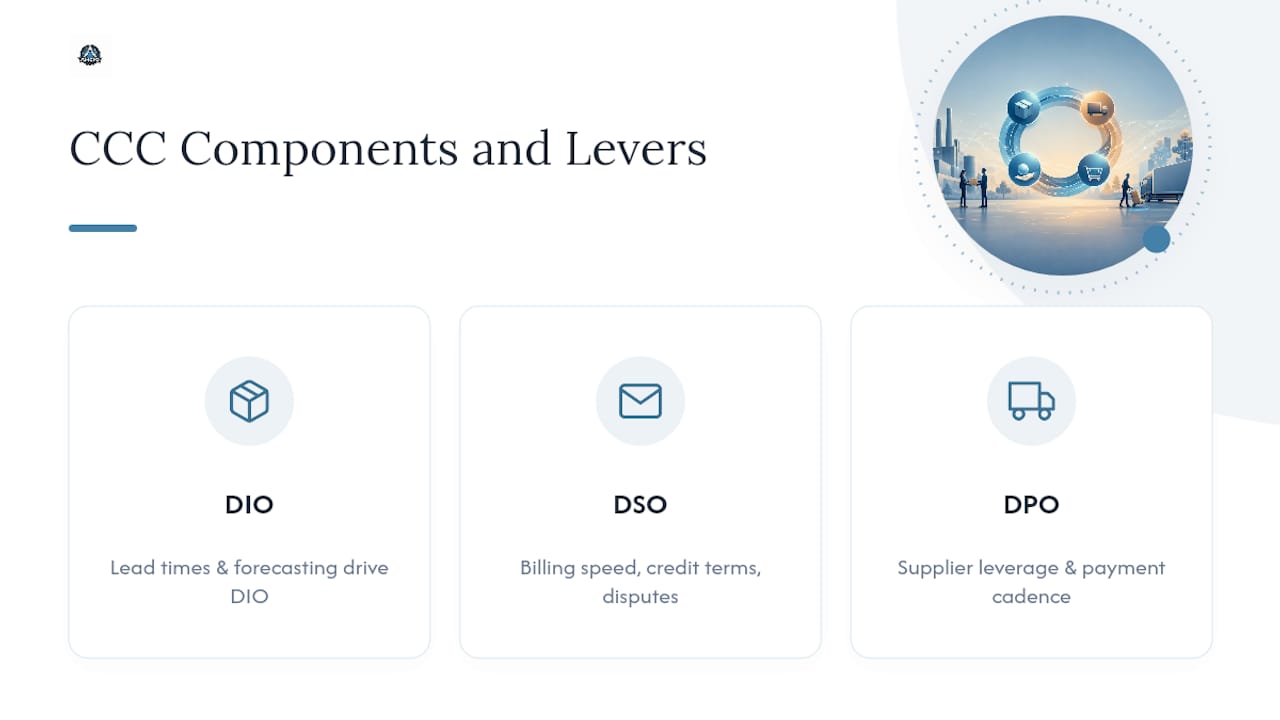
DIO moves with how well you plan and how complex your product line is. Long supplier lead times force you to hold more safety stock, which inflates inventory days. Weak demand forecasting does the same thing, since you either overbuy to avoid stockouts or underbuy and scramble. Companies with hundreds of SKUs almost always carry higher DIO than companies with a tight, rationalized product line, simply because more variety means more slow-moving stock sitting on shelves.
DSO moves with how fast you bill and how disciplined your credit policy is. A business that invoices three days after delivery will always outperform one that invoices three weeks later, all else equal. Credit policy matters just as much: loose terms extended to win a sale often come back to bite you in DSO. Dispute rates matter too. Every invoice that gets kicked back for a billing error or missing PO number adds days, sometimes weeks, to collection time.
DPO moves with supplier terms and how much leverage you actually have. A company with real bargaining power can negotiate net 60 or net 90 terms; a small business with one dominant supplier often has no choice but net 15. Procurement cadence matters here too. Businesses that batch purchase orders and pay on a predictable schedule tend to negotiate better terms than those that order reactively.
The catch is that these three levers don't move independently. Push DPO too far and you strain supplier relationships, sometimes to the point where suppliers start demanding deposits or drop your priority in their production queue. Tighten DSO too aggressively with rigid credit terms, and you risk losing customers to a competitor who's more flexible. Operations decisions like scheduling and production speed are often the real root cause behind a bloated DIO, which means fixing CCC frequently requires the CFO and operations leadership working the same problem from different angles.
Pro Tip: Before touching credit terms or supplier contracts, map your CCC by component for the last four quarters. If DIO is the outlier, the fix is almost always operational (forecasting, SKUs, lead times), not financial. Don't let a finance team "solve" an operations problem with a policy change that annoys customers or suppliers instead.
Why Does CCC Matter, and What Do Good Benchmarks Look Like?
A lower CCC almost always signals better working capital efficiency, because cash is tied up for fewer days before it's available to reinvest, pay down debt, or hold as a buffer. But "lower is better" only holds true within reason, and benchmarks vary enormously by sector.
- Retail and grocery frequently post negative CCC, since they collect cash from customers immediately but pay suppliers on 30 to 60 day terms.
- Restaurants often run negative CCC too, for the same reason: near-instant customer payment against delayed supplier payment.
- Manufacturing and distribution typically run positive CCC, often 30 to 90 days, because of longer production cycles and standard trade credit to customers.
- Construction and heavy equipment can run CCC well past 90 days given long project cycles and extended payment terms on both ends.
A single CCC figure taken in isolation tells you less than the trend. A company whose CCC has climbed from 45 to 65 days over three quarters has a real problem building, even if 65 days sound fine on paper compared to industry averages. Quarter-over-quarter tracking catches deterioration before it becomes a cash crisis.
Negative CCC deserves a second look before you celebrate it. It's often a genuine sign of efficiency in retail-style models. But a negative CCC driven by stretching payables past reasonable terms rather than genuine operating speed is hiding risk, not eliminating it. That kind of negative CCC tends to unwind fast the moment a key supplier tightens terms or demands payment upfront.
There's also a growth trap worth naming directly. Fast-growing companies can see inventory and receivables needs to outpace incoming cash, even while the business looks profitable on paper. That's the "growing out of money" problem, and it's one of the more common reasons profitable companies still need a credit line or outside financing to fund expansion.
Tactical Playbook: How Do You Actually Shorten Your CCC?
Shortening CCC is really three separate projects running in parallel, each with different levers, timelines, and risks. Trying to fix everything at once usually backfires, so sequencing matters as much as the tactics themselves.
1. Inventory (DIO): start here if inventory is your biggest lever. Better demand planning is the highest-leverage, lowest-risk move: tighter forecasting reduces both stockouts and overstock simultaneously. SKU rationalization, cutting slow-moving products that tie up warehouse space and cash, often frees up more working capital than any single negotiation. Just-in-time (JIT) ordering and vendor-managed inventory arrangements can cut DIO meaningfully, but they require reliable suppliers and real coordination. A structured cycle counting process also helps by catching shrinkage and dead stock before it quietly inflates your inventory days for months.

2. Receivables (DSO): usually the fastest win with the least operational disruption. Invoice the same day goods ship, not a week later. Move to e-invoicing so invoices don't sit in someone's inbox. Tighter credit checks on new accounts prevent tomorrow's DSO problem rather than fixing today's. Track dispute rate and average days-to-resolve as leading indicators. A dedicated collections workflow that flags overdue invoices automatically, rather than relying on someone remembering to follow up, is often the single highest-ROI change in this category.
3. Payables (DPO): the highest-risk lever, so move carefully. Negotiating longer terms with suppliers works, but only when you have genuine leverage. Supply chain finance programs can extend effective payment terms without straining the supplier relationship, since the supplier gets paid early by a third party while you still pay on your negotiated schedule. The mistake to avoid is stretching payments past agreed terms just because you can. That erodes trust fast, and suppliers respond by tightening your terms, requiring deposits, or deprioritizing your orders when supply is tight. If a supplier offers an early-pay discount that beats your cost of capital, take it. Don't reflexively extend payment just to improve a metric.
Sequencing and governance matter more than most finance teams assume. Run each tactic as a pilot on one product line, region, or customer segment before rolling it out company-wide. Track the specific KPI tied to each lever (inventory turns, average days-to-pay-invoice, dispute rate) rather than just watching the headline CCC number, since CCC can improve for the wrong reasons, like accidentally losing a low-margin customer segment. Analyzing CCC alongside profitability metrics such as ROA and ROE keeps the team from optimizing a single number at the expense of the business.
Pro Tip: Assign one owner per component. Operations owns DIO, sales and finance jointly own DSO, and procurement owns DPO. When one team owns the whole CCC number, the easiest lever always wins, even when it's the wrong one for the business.
A Worked Example: Calculating CCC Step by Step
Take a mid-sized distributor with these annual figures: average inventory of $500,000, COGS of $3,650,000, average accounts receivable of $600,000, revenue of $7,300,000, and average accounts payable of $400,000.
DIO = ($500,000 ÷ $3,650,000) × 365 results in a number of days representing inventory turnover DSO = ($600,000 ÷ $7,300,000) × 365 results in a number of days representing receivables collection DPO = ($400,000 ÷ $3,650,000) × 365 results in a number of days representing payables deferral
CCC = DIO + DSO − DPO calculates the operating cycle in days
Now run a scenario: the company tightens its collections process and cuts DSO from 30 days to 20 days, a 10-day improvement. New CCC = 50 + 20 − 40 = 30 days. That 10-day reduction, applied to $7,300,000 in annual revenue, frees up roughly $200,000 in cash that was previously locked up in unpaid invoices, cash now available for inventory, debt paydown, or growth without touching a credit line.
How Amcfo Helps You Turn CCC Analysis Into Cash
Amcfo works with clients to isolate which component (inventory, receivables, or payables) is dragging on cash, then builds a sequenced plan around it. That means bookkeeping and accounting support for clean, averageable balance-sheet data, AR cleanup, forecasting, and vendor negotiation support, all coordinated through fractional CFO consulting rather than a one-off report nobody implements.
- Assess: pull accurate DIO, DSO, DPO from your books
- Prioritize: identify the highest-ROI lever first
- Pilot: test changes on a limited scale
- Measure: track KPIs monthly, not just at year-end
An improvement in DSO by a number of days on approximately $7 million in revenue can free up a notable amount of cash, as detailed in linked financial education resources, providing liquidity that supports business growth without incurring new debt.
An Editorial Take on Fixing Your Cash Conversion Cycle
Most CCC advice treats it like a pure math problem: shrink the number, win. That's backwards. The real skill is knowing which lever to leave alone. Stretching payables until suppliers push back, or tightening credit until customers walk, produces a great-looking CCC and a worse business.
The conventional wisdom also underweights sequencing. Everyone wants to fix all three components simultaneously, which usually means nobody owns any of them well. Pilot one lever, measure it against a real KPI, then move to the next.
If you take one thing from this guide, make it this: pull your CCC trend for the last four quarters before you touch a single policy. A number that's climbing quietly is a bigger problem than a number that's simply higher than your industry average. Direction beats benchmark almost every time.
— Angelica
Sources
- Understanding & Optimizing Your Cash Conversion Cycle (CCC)
- Working Capital Cycle Explained: Formula, Steps, & Examples
- Principles of Finance (OpenStax) — What is working capital
- Working Capital Management: Ensuring Cash Flow & Efficiency