

Break-even analysis tells you the exact sales volume where revenue equals total costs, the point at which fixed costs, variable costs, and contribution margin stop working against you and start covering themselves. Once you have that number, in units or dollars, the next move is simple: run your own fixed and variable costs through the formula below and compare the result against current sales. A worked example follows so you can copy the math directly.
TL;DR:
- Fixed costs, such as rent and salaries, directly increase the break-even volume when they rise, requiring higher sales to cover expenses.
- Variable costs, including materials and commissions, shrink contribution margins, thus raising the break-even point when they increase.
- A fluctuating sales mix can distort the weighted-average contribution margin, necessitating regular recalculation of the break-even point for accuracy.
- Testing the break-even point under different scenarios, such as price drops or cost hikes, helps assess the business’s margin of safety and resilience.
- Break-even analysis is most useful before pricing changes, product launches, hiring, or funding, to set realistic revenue targets and evaluate cost structure risks.
Table of Contents
- What Is Break-Even Analysis and When Do You Use It?
- What Is the Break-Even Formula?
- How Do You Calculate a Break-Even Point Step by Step?
- What Costs Count as Fixed, Variable, or Semi-Variable?
- When Should You Run a Break-Even Analysis?
- What Are the Limitations of Break-Even Analysis?
- How Do You Stress-Test Your Break-Even Point?
- How Do You Run This With Your Own Business Data?
- How Fractional CFOs Use Break-Even Analysis in Practice
- How Does Break-Even Analysis Work With Multiple Products?
- How Does Break-Even Analysis Connect to Profit Targets?
- What Happens to Break-Even When Cost Structure Changes?
- How Does Break-Even Analysis Guide Make-or-Buy and Product Decisions?
- Practitioner Takeaway: What to Do After You Calculate BEP
- How AmCFO Helps You Put Break-Even Analysis to Work
- Sources
- FAQ
What Is Break-Even Analysis and When Do You Use It?
Break-even analysis calculates the sales level at which total revenue equals total costs, meaning the business has zero profit and zero loss at that exact volume. Every dollar sold past that point contributes to actual profit. The SBA frames this around five components: fixed costs, variable costs, revenue, contribution margin, and the break-even point itself.
You'll want this number in a few recurring situations:
- Setting or adjusting prices before a launch
- Deciding whether a new product or service line is worth pursuing
- Evaluating a hiring decision that raises fixed payroll costs
- Preparing projections for a lender or investor
- Checking whether an expansion (new location, new equipment) pencils out
The break-even point (BEP) can be expressed two ways: as a number of units sold, or as a dollar figure. Both come from the same inputs, just arranged differently.
What Is the Break-Even Formula?
The unit formula is straightforward: BEP (units) = Fixed Costs ÷ (Price per Unit − Variable Cost per Unit). The denominator there, price minus variable cost, is your contribution margin per unit, the amount each sale contributes toward covering fixed costs before it starts generating profit.
For a sales-dollar figure instead of a unit count, you use the contribution margin ratio: BEP (sales dollars) = Fixed Costs ÷ Contribution Margin Ratio, where the ratio is contribution margin divided by price. Investopedia's breakdown of these formulas is the standard reference most accounting textbooks build from.
- Fixed costs: rent, salaries, insurance, software subscriptions, anything that doesn't move with sales volume
- Variable costs: materials, direct labor tied to output, shipping, sales commissions
- Contribution margin: price minus variable cost per unit
- Contribution margin ratio: contribution margin divided by price, expressed as a percentage
Quick reference: if your contribution margin ratio is 40%, every dollar of sales puts 40 cents toward fixed costs until you cross break-even, then 40 cents toward profit.
How Do You Calculate a Break-Even Point Step by Step?
Here's a compact break-even analysis example using round numbers you can swap for your own.
Say a small manufacturer has fixed monthly costs that do not vary with production, sells a product at a certain price, and pays a certain amount per unit in variable costs (materials and direct labor).
- Find the unit contribution margin: price minus variable cost per unit
- Calculate BEP in units: fixed costs divided by unit contribution margin
- Calculate the contribution margin ratio: unit contribution margin divided by price
- Calculate BEP in sales dollars: fixed costs divided by contribution margin ratio
The takeaway: this business needs to sell enough units, or generate sufficient revenue, before it earns a cent of profit. Round up, not down, when your result lands on a fraction of a unit. You can't sell part of a unit, so rounding up ensures you cover costs.
What Costs Count as Fixed, Variable, or Semi-Variable?
Most misclassification problems trace back to lumping semi-variable costs into the wrong bucket. Rent, salaried payroll, insurance premiums, and loan payments are fixed. Materials, hourly labor tied directly to production, and shipping are variable.
Semi-variable costs (utilities that have a base charge plus usage fees, or a phone plan with a fixed rate plus overage charges) need to be split. Take the fixed portion, put it with fixed costs, and forecast the variable portion against expected volume.
- Sales commissions often get miscounted as fixed when they're actually variable
- Minimum vendor contracts (a $500 monthly minimum regardless of usage) behave like fixed costs even though they're billed as usage-based
- Tiered pricing from suppliers can shift your variable cost per unit as volume increases, which throws off a static BEP calculation
- Annual or quarterly fixed costs (insurance premiums, software renewals) need to be divided into monthly equivalents so they don't distort a single month's numbers
Pro Tip: When payroll blends a fixed salary with variable overtime, split the base pay into fixed costs and forecast the overtime hours separately as a variable cost. Document that assumption so you can reclassify it later once actual overtime data comes in.
When Should You Run a Break-Even Analysis?
Run the numbers any time you're about to change price, launch a product, add headcount, or approach a lender. Each scenario shifts either your fixed costs, variable costs, or both, which moves the break-even point.
The payoff goes beyond a single number. Break-even analysis sets a concrete revenue target your sales team can work toward, and it often exposes hidden costs that don't show up until you actually map every expense to the formula.
- Pricing decisions: test how a $2 price increase or decrease shifts your break-even volume
- Product launches: confirm the product can realistically hit break-even volume within a reasonable timeframe
- Hiring: a new fixed salary raises your break-even point, so weigh that against expected revenue lift
- Funding prep: lenders and investors expect to see break-even math in a loan or investment package
What Are the Limitations of Break-Even Analysis?
The model assumes costs and revenue behave in a straight line, that your sales mix stays constant, and that inventory levels don't shift. Real businesses rarely hold all three assumptions steady for long.
Break-even analysis also doesn't tell you whether customers will actually buy at that volume, or how long it will take to get there. It's a cost and pricing tool, not a demand forecast.
- Linearity breaks down at high volume, when bulk discounts or capacity limits change your cost curve
- A shifting sales mix (more of a low-margin product, less of a high-margin one) moves your blended break-even point without you noticing
- Inventory build-up or drawdown can distort revenue-to-cost timing within a given period
- Run a sensitivity test alongside the base case rather than trusting one static number
How Do You Stress-Test Your Break-Even Point?
Recompute your BEP under a couple of adverse scenarios before you rely on the base case for a decision. Move price down 5%, or push variable costs up 10%, and watch how much the break-even volume shifts.
- Recalculate contribution margin using a lower price or higher variable cost
- Divide fixed costs by the new contribution margin to get the stressed BEP
- Compare the stressed BEP against your realistic sales ceiling
Then calculate your margin of safety: current sales minus break-even sales, divided by current sales. If you're selling 6,000 units against a break-even of 5,000, your margin of safety is about 17%, meaning sales could drop that much before you hit the floor.
Treat it as a working heuristic, not a hard target.*
How Do You Run This With Your Own Business Data?
Pull your actual profit and loss statement, sales reports, vendor invoices, and payroll records rather than estimating from memory. Every fixed and variable cost in the formula should map back to a real line item, not a guess.
Match rent, salaries, and insurance to fixed costs. Match materials, commissions, and hourly production labor to variable costs. If a QuickBooks chart of accounts is already organized by cost type, this mapping takes minutes instead of hours.
- Run the calculation monthly for operational tracking, especially in a business with seasonal swings
- Do a deeper quarterly review that factors in cost structure changes, new hires, or supplier price shifts
- Reconcile actual results against your projected break-even point and adjust assumptions that drifted
If your books aren't clean enough to trust the inputs, that's the first problem to fix. Efficiency and cost analysis work often starts by untangling exactly which costs are fixed versus variable before anyone touches the BEP formula. A fractional CFO layering this into ongoing financial planning also keeps the number current as costs shift, rather than letting it go stale after one calculation.
How Fractional CFOs Use Break-Even Analysis in Practice
Break-even math shows up constantly in fractional CFO engagements, usually as a starting point rather than the finish line. It feeds directly into forecasting models, efficiency reviews, and the projections lenders expect to see.
- Forecasting: BEP anchors revenue targets in a rolling budget rather than a static annual number
- Efficiency analysis: comparing actual costs against the BEP model often flags fixed costs that crept up unnoticed
- Lender-ready projections: banks and investors want to see the break-even math behind revenue assumptions, not just the assumptions themselves
For businesses where the general consulting relationship already touches profitability planning, break-even analysis tends to become a recurring checkpoint rather than a one-time exercise.
How Does Break-Even Analysis Work With Multiple Products?
A single-product BEP formula falls apart the moment a business sells more than one item, because each product likely carries a different price and a different variable cost. The fix is a weighted-average contribution margin.
Take each product's contribution margin, multiply it by that product's share of total forecasted sales, and add the results together. That weighted figure replaces the single contribution margin in your original formula, giving you a combined break-even point across the whole product mix.
Say a bakery sells cupcakes with a $2 contribution margin and custom cakes with a $15 contribution margin. If cupcakes make up 70% of forecasted sales and cakes make up 30%, the weighted contribution margin is (0.70 × $2) + (0.30 × $15), or $1.40 + $4.50, for a blended $5.90. Divide fixed costs by that number to get the combined break-even point.
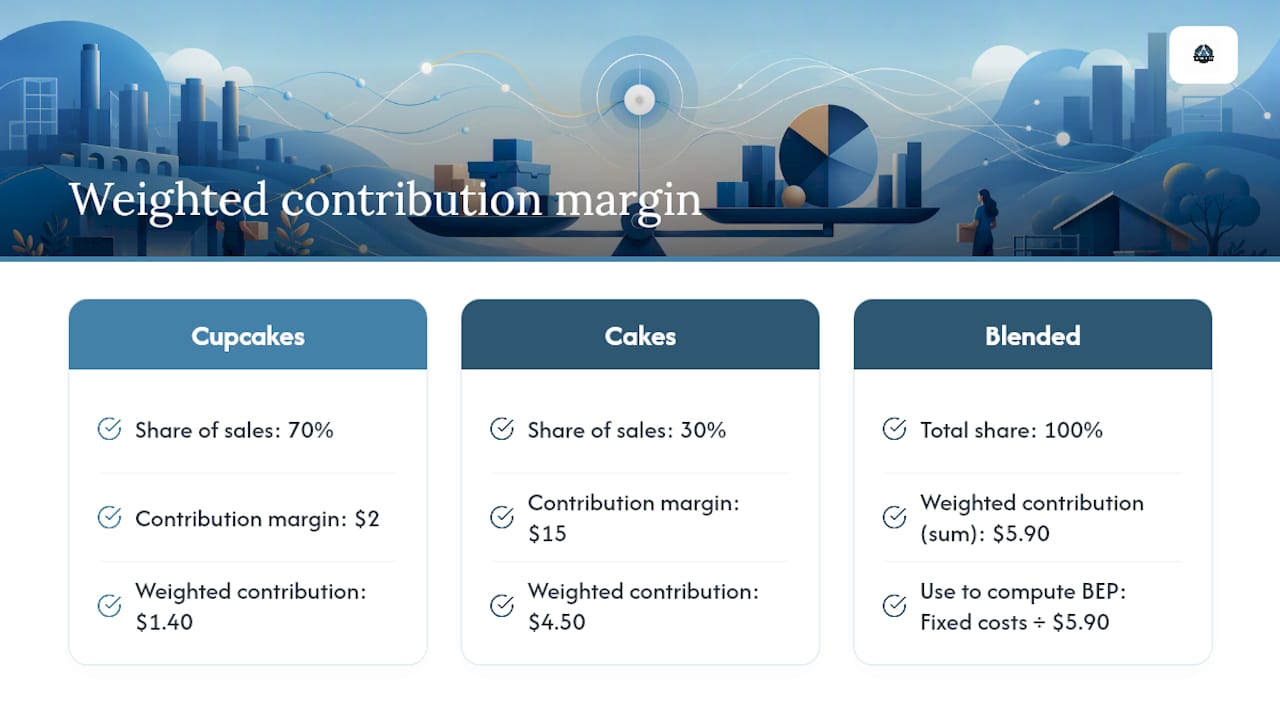
The catch is that this number only holds as long as the sales mix stays roughly the same. If cupcakes suddenly become 90% of sales instead of 70%, the weighted average shifts and the old BEP figure no longer reflects reality. Businesses with a volatile mix, seasonal menus, a shifting service lineup, project-based work with varying margins, need to recalculate this more often than a single-product business would. Quarterly at minimum, monthly if the mix moves fast.
This is also where product-line decisions get made. If one product's individual contribution margin is thin enough that it drags down the blended average without adding meaningful volume, that's a signal to reprice it, bundle it differently, or drop it.
How Does Break-Even Analysis Connect to Profit Targets?
Break-even is the floor, not the goal. Once you know the volume or dollar figure where costs and revenue meet, adding a specific profit target on top just extends the same formula.
Instead of solving for zero profit, solve for a target profit by adding it to fixed costs before dividing: Units Needed = (Fixed Costs + Target Profit) ÷ Contribution Margin per Unit. If that manufacturer from the earlier example wants $20,000 in monthly profit instead of just breaking even, the math becomes ($50,000 + $20,000) ÷ $10, or 7,000 units instead of 5,000.
That 2,000-unit gap between break-even and target profit is the real planning number. It tells you exactly how much additional sales activity, marketing spend, or sales capacity you need beyond the survival threshold. Owners who only track the break-even figure tend to celebrate hitting it, when it was never the actual goal.
This connection matters most when you're setting quotas or commission structures. A sales target built off gut feeling might sit below break-even without anyone noticing until the quarter closes. A sales target built off the profit-adjusted BEP formula guarantees that hitting quota also means hitting a real profit number, not just covering costs. It's a cleaner way to align sales incentives with what the business actually needs to earn.
What Happens to Break-Even When Cost Structure Changes?
Every cost structure shift, a new hire, a rent increase, a supplier price hike, moves the break-even point, and the direction of that move depends on which side of the ledger changed.
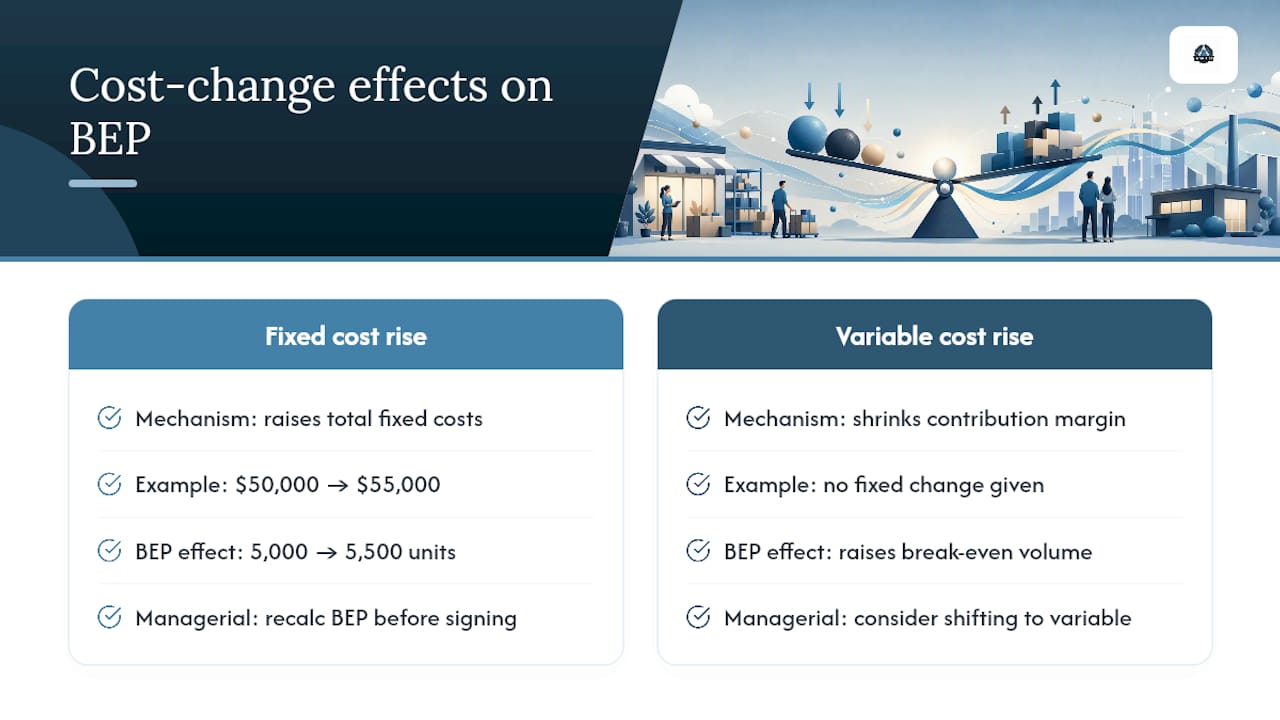
Adding fixed costs raises the break-even point directly. A $5,000 monthly rent increase on that same manufacturer pushes fixed costs from $50,000 to $55,000, which raises the unit break-even from 5,000 to 5,500 units, a jump you'd want to know about before signing the lease, not after.
Variable cost increases hit differently. They shrink the contribution margin per unit, which raises break-even volume even though fixed costs never moved.
This is exactly why NetSuite's guidance frames break-even analysis as a decision tool for choosing between fixed and variable cost structures, not just a static calculation. A business trying to lower risk might deliberately shift costs from fixed to variable, switching from salaried staff to contractors, or from owned equipment to a pay-per-use lease, because variable-heavy cost structures lower the break-even point and reduce exposure during slow periods. The tradeoff is that variable-heavy structures often cost more per unit when volume is high, so the right structure depends on how predictable your sales volume actually is.
Recalculating BEP after any structural cost change, not just once a year, catches these shifts while there's still time to adjust pricing or negotiate the change itself.
How Does Break-Even Analysis Guide Make-or-Buy and Product Decisions?
Break-even analysis earns its place in bigger decisions once you stop treating it as a one-off calculation and start feeding it into comparisons between alternatives.
A make-or-buy decision is a direct application. Making a component in-house usually means higher fixed costs (equipment, dedicated labor) and lower variable cost per unit. Buying it from a supplier flips that: little to no added fixed cost, but a higher variable cost per unit. Running break-even math on both options side by side reveals a crossover volume, the point where making it in-house becomes cheaper than buying it. Below that volume, buying wins. Above it, making it in-house wins.
Product line evaluation works the same way. A product with a break-even volume that sits close to, or above, realistic demand is a candidate for repricing, cost reduction, or discontinuation. A product that clears break-even easily and keeps contributing margin well past that point is one worth protecting shelf space, marketing budget, or production capacity for.
The Yale School of Management framing is useful here: the real value of break-even analysis isn't the arithmetic, it's using the output to frame alternative scenarios before committing capital or headcount. Treat every make-or-buy call, every product-line review, and every expansion decision as a chance to run the numbers side by side rather than trusting instinct alone.
Practitioner Takeaway: What to Do After You Calculate BEP
Verify your cost data before trusting the output, run a sensitivity test on price and cost shocks, build in a margin-of-safety buffer, and put break-even tracking on a recurring dashboard rather than a one-time spreadsheet.
— Angelica
How AmCFO Helps You Put Break-Even Analysis to Work
A fractional CFO engagement starts by reviewing your actual records, not estimates, then builds the break-even and sensitivity analysis directly into your forecasting model so it stays current as costs shift.

The typical first step looks like this: a review of your P&L, payroll, and vendor invoices to correctly classify fixed and variable costs, followed by a break-even and margin-of-safety calculation, then a short action plan covering pricing, cost cuts, or hiring timing based on what the numbers actually show. If you're preparing for a lender conversation, that same analysis doubles as the backbone of your projections, and a funding partner like Formosity Funding can pick up the financing conversation once your numbers are lender-ready. Start with a fractional CFO engagement built around your actual books, not a generic template.
This article is general information, not a substitute for advice from a qualified financial advisor. Consult a qualified financial professional about your own circumstances before acting on anything here.
Sources
- Break-even point | U.S. Small Business Administration
- Break-Even Analysis: What It Is, How It Works, and Formula | Investopedia
- A Primer on Breakeven Analysis | Yale School of Management
- What Is Break-Even Analysis: Formula and Guide | NetSuite
FAQ
What Is a Break-Even Analysis?
It's a calculation that identifies the sales volume, in units or dollars, where total revenue equals total costs, meaning the business has zero profit and zero loss at that exact point.
How Do You Calculate Break-Even?
Divide fixed costs by the contribution margin per unit to get the break-even point in units, or divide fixed costs by the contribution margin ratio to get it in sales dollars.
What Are the Main Components of Break-Even Analysis?
Fixed costs, variable costs, revenue, contribution margin, and the break-even point itself make up the core components used to build the calculation.
What Is an Example of a Break-Even Analysis?
A business with fixed costs, price, and variable cost per unit has a contribution margin, putting break-even at a number of units or dollar sales.
Does AmCFO Help Businesses Calculate Their Break-Even Point?
Yes. A fractional CFO engagement through Amcfo typically starts with reviewing actual financial records, then builds the break-even and sensitivity analysis into ongoing forecasting.